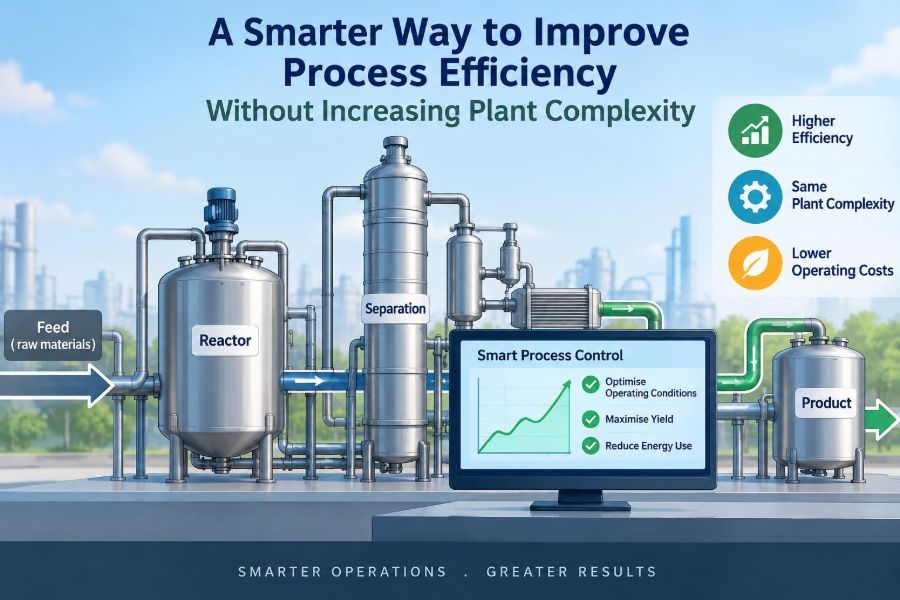

A distillation column misses its energy target. A compressor seems to run harder than it should. Operators compensate for a drifting feed by moving setpoints, while maintenance sees more starts, stops, and alarms than usual.
The instinctive response is often to propose more equipment: a larger exchanger, another control loop, an extra separator, or a new analytics platform. Sometimes that is justified. But new hardware also brings capital cost, tie-ins, control interactions, training demands, and fresh failure modes.
Many efficiency losses do not begin with missing equipment. They begin with variation, poor visibility, unclear operating limits, and decisions made around average conditions rather than real process behavior.
A smarter improvement path is to make the existing plant more predictable, better measured, and easier to operate at its true optimum. That approach does not reject capital projects; it helps identify when they are genuinely needed.
🎯 Start with the Meaning of Efficiency
Process efficiency is not simply low energy use. It is the useful conversion of feed, energy, time, and equipment capacity into safe, on-specification product with minimum avoidable loss.
A unit can have low steam consumption yet be inefficient if it creates off-spec material, excessive recycle, lost production time, or maintenance damage. Conversely, a slightly higher utility rate may be sensible if it stabilizes a bottleneck and raises valuable throughput.
Before changing anything, define the decision metric. It may be yield, specific energy per tonne of accepted product, recovery, on-stream time, emissions intensity, or contribution margin. The best metric reflects the plant’s real constraint and product value.
🧭 Find the Constraint Before Chasing Losses
Every operating system has a limiting resource. It may be reactor residence time, furnace duty, cooling-water temperature, a compressor’s surge margin, filtration capacity, tank availability, or an operator’s ability to manage unstable conditions.
Improving a non-constraint can make a local trend look better without improving the plant. For example, reducing a pump’s power draw matters little if downstream drying capacity determines production. It can even worsen performance if reduced flow makes that dryer less stable.
Map the process from feed receipt to shipping and ask: where does material wait, where do operators repeatedly intervene, and where does throughput flatten despite increased effort? Those clues often reveal the active constraint.
🔎 Separate Average Performance from Variability
Average values are useful, but they can hide the behavior that costs the most. A reactor temperature may average exactly at target while cycling widely above and below it. Product quality, catalyst life, and downstream separation can all suffer from those swings.
Variation creates a safety buffer. If a quality limit must never be exceeded, operators naturally keep the average farther from that limit when the process is noisy. Reducing the noise can therefore release capacity without changing the equipment.
Look at distributions, trends, event logs, and the frequency of limit approaches—not only monthly averages. A narrow, controlled operating band is often more valuable than a good-looking mean.
📏 Build a Trusted Mass and Energy Picture
A simple balance is one of the strongest diagnostic tools in chemical engineering. Over a defined time period, compare material entering, material leaving, inventory change, and known losses. Do the same for energy where practical.
An unexplained gap may indicate a meter problem, an unrecognized purge, a leaking utility valve, an incorrect density conversion, or sampling that does not represent the stream. It can also expose a flawed assumption about composition.
Balances need not begin as elaborate models. A spreadsheet using reconciled production data, laboratory results, and reasonable uncertainty ranges can identify which unknown is worth investigating next.
🧪 Verify Measurements Before Optimizing Them
A control strategy cannot outperform the information supplied to it. Instruments drift, impulse lines plug, temperature sensors become poorly coupled to the process, and flowmeters may be used outside their reliable range.
When two measurements disagree, do not automatically select the one that supports the preferred explanation. Check calibration history, installation, process conditions, timing, and whether each instrument measures the same physical quantity.
A practical priority is to focus on measurements that affect material balance, quality release, energy allocation, constraints, and protective actions. Better data at these points usually has more value than collecting large volumes of unimportant tags.
🗺️ Translate Data into an Operating Window
An operating window defines the ranges in which a process can run safely, reliably, and economically. Unlike a single setpoint, it recognizes that feed composition, ambient conditions, equipment condition, and product grade can change the best target.
For a distillation system, the window may connect reflux, pressure, reboiler duty, feed rate, and top and bottom quality. For a reactor, it may connect temperature, reactant ratio, residence time, and heat-removal capability.
Write down both hard boundaries and preferred ranges. Hard boundaries protect safety, equipment, or specification; preferred ranges minimize energy use, fouling, or operator workload. Mixing these categories causes confusion during upset response.
⚙️ Treat Control Loops as a System
Plants often accumulate loops one at a time. Each may appear reasonable alone, yet several can interact: a pressure controller moves a valve that affects level, a temperature controller changes steam demand, and a utility header responds to the resulting disturbance.
Poor tuning is not always the root cause. A cycling valve, oversized actuator, sticky positioner, incorrect process model, or poorly chosen manipulated variable can make a well-tuned controller look ineffective.
Review loops in the order that disturbances travel through the process. Stabilize inventories and major disturbances first, then improve quality and optimization control. Trying to optimize an unstable base layer usually produces constant manual correction.
🎛️ Use Setpoints That Follow the Feed
Fixed setpoints are convenient, but they assume the process is unchanged. In real operation, feed density, impurity level, moisture, heating value, and flow may shift enough that the old target is no longer economical.
Feed-forward control uses a measured disturbance to adjust a controller before quality has fully moved. A familiar example is adjusting fuel demand when measured feed rate changes, while feedback from temperature or composition corrects remaining error.
This does not require a complicated model at first. A carefully tested relationship between a reliable feed measurement and a downstream target can reduce lag and operator intervention. It must be bounded so bad measurements cannot drive unsafe action.
🧠 Distinguish Automation from Understanding
More automation is not automatically more efficient. An advanced application built on bad sensors, unknown valve behavior, or an incomplete operating philosophy can make process behavior harder to interpret.
The useful sequence is understanding, standardization, basic control health, then appropriate automation. In some units, a clear operator decision guide and a reliable alarm rationalization will deliver more than an elaborate optimization package.
Automation should remove repetitive adjustment and handle predictable disturbances. It should not conceal unresolved process instability or transfer poorly understood decisions into code.
🔥 Recover Heat Before Buying More Heat
Heating and cooling systems are common sources of avoidable loss because utilities are visible on bills but less visible in day-to-day process decisions. The first question is not always “Can we add a heat exchanger?” but “Is existing heat being used at the right temperature level?”
Check exchanger approach temperatures, bypass positions, fouling indicators, condensate recovery, steam-trap condition, insulation damage, and unnecessary simultaneous heating and cooling. These issues often degrade gradually and become accepted as normal.
Heat integration has limits. Recovering heat can increase fouling, cross-contamination risk, pressure drop, or controllability problems. The right design preserves operability, not merely a favorable energy balance on paper.
💨 Examine Utility Quality, Not Only Utility Quantity
Steam pressure, compressed-air dryness, cooling-water temperature, vacuum stability, and electrical supply quality can strongly influence unit performance. A process may appear inefficient when the underlying utility is variable or unsuitable for the duty.
For example, unstable steam pressure can disturb reboiler duty and separation quality. A compressed-air leak increases compressor loading, but wet or contaminated air can also make control valves and instruments behave inconsistently.
Track utilities at the conditions that matter to the process. Total consumption alone cannot show whether a particular unit receives reliable service at the required pressure, temperature, or purity.
🧱 Reduce Pressure Drop Where It Buys Capacity
Pressure drop consumes pumping or compression energy and can restrict throughput. It rises with fouling, plugged strainers, partially closed valves, undersized piping, damaged internals, or operation outside the original flow range.
Not every pressure drop deserves removal. Some is intentional: control valves need authority, filters protect equipment, and reactor internals create needed contact. The aim is to identify unproductive pressure loss, not to minimize every differential pressure.
Trend differential pressure across exchangers, filters, columns, and key piping sections alongside flow. A changing relationship is often more revealing than a single reading.
🧫 Protect Yield from Small Composition Shifts
Yield losses frequently hide in specifications that are technically met but operated too conservatively, or in reaction conditions that favor by-products during transient periods. Minor feed-ratio or moisture changes can have large downstream consequences.
Use representative sampling and understand analyzer delay. A laboratory result may describe material produced hours earlier, so a correction made after the result arrives can overshoot the actual process state.
Where online analyzers are available, validate them against a sound reference method and account for sampling-system lag. Where they are not, combine faster proxy variables with disciplined lab feedback rather than relying on a single delayed result.
🔄 Make Recycle Streams Visible
Recycle is valuable when it recovers useful material, but it also transports impurities, heat, variability, and inventory around the plant. A rising recycle rate can create a hidden feedback loop that eventually overwhelms a separator or reactor.
Document recycle flow, composition, temperature, and destination. Then ask whether each recycle is intentional recovery, temporary troubleshooting, or a workaround that became permanent.
A small, well-placed purge can sometimes prevent impurity accumulation, but it may increase valuable material loss and waste treatment. Its rate should be based on a composition balance, not habit.
🧹 Attack Fouling as a Process Problem
Fouling is often handled as a maintenance fact of life. Yet deposit formation can depend on local temperature, velocity, dead zones, concentration, incompatible mixing, oxygen ingress, or excursions during startup and shutdown.
Cleaning restores performance, but understanding the deposition mechanism may extend the interval between cleanings. For instance, changing a heating sequence or avoiding a high-concentration hold can be more effective than merely increasing cleaning frequency.
Monitor symptoms such as rising pressure drop, declining heat-transfer performance, changing control-valve position, or longer batch times. These trends can support intervention before a loss becomes an outage.
🛠️ Turn Operator Knowledge into Standard Work
Experienced operators often know the sounds, trends, and combinations of symptoms that precede trouble. If that knowledge stays informal, performance can vary sharply between shifts and disappear when people change roles.
Standard work is not a rigid script for every circumstance. It records the normal sequence, key checks, acceptable response ranges, escalation points, and reasons behind critical actions.
Useful procedures describe what to observe as well as what to do. “Increase reflux” is weaker than “if confirmed top composition is trending high and column pressure is stable, adjust reflux within the approved operating window and reassess after the known process delay.”
🚦 Design Alarms That Support Decisions
An alarm should prompt a timely, meaningful response. When alarms are excessive, repeated, or poorly prioritized, people learn to acknowledge them without acting—a condition often called alarm fatigue.
Review recurring alarms for cause, consequence, response, and priority. Some should become maintenance notifications; others may require a better control strategy or a different limit. Safety-critical alarms need especially clear ownership and testing.
Reducing nuisance alarms is an efficiency measure because it restores attention to real deviations. It also makes manual operation less stressful during disturbances.
🧯 Improve Startup, Shutdown, and Grade Changes
Steady-state efficiency receives attention because it is easy to calculate, but transitional periods can consume disproportionate energy, produce off-spec material, and accelerate fouling. These periods are where procedures and coordination matter most.
Break each transition into stages with verified conditions: line-up, warm-up, inventory establishment, controlled ramp, stabilization, quality confirmation, and handover. Define hold points rather than relying on elapsed time alone.
After every unusual transition, capture what differed from the standard sequence. The goal is not blame; it is to turn a one-off recovery into a safer, more repeatable method.
📊 Use Simple Performance Indicators Carefully
A small set of indicators can focus improvement work. Good indicators connect an action to a physical result: steam per unit of accepted production, unplanned recycle rate, pressure drop at a specified flow, or time spent outside a defined operating window.
Normalize where needed. Total energy can rise simply because output rises, whereas specific energy may reveal whether the process itself improved. Also separate planned from unplanned downtime and accepted from reworked product.
| Indicator | What it can reveal | Common interpretation trap |
|---|---|---|
| Specific energy | Energy intensity of accepted production | Ignoring changes in product grade or feed quality |
| Control-valve position | Loss of control authority or changing resistance | Assuming position alone proves a valve fault |
| Recycle-to-feed ratio | Recovery burden and impurity circulation | Treating all recycle as waste |
| Time in operating window | Stability and operating discipline | Choosing a window so wide it has no meaning |
🧩 Compare Options by Total System Effect
An improvement can shift a burden rather than remove it. Raising a reactor temperature may increase conversion but impose a larger separation duty. Lowering a column pressure can improve relative volatility while demanding more refrigeration or vacuum capacity.
Evaluate changes across feed preparation, reaction, separation, utilities, waste, quality, maintenance, and safety. This is particularly important when different departments own different parts of the same material balance.
A short trial plan should state the hypothesis, expected benefits, possible adverse effects, safe limits, data to collect, and criteria for stopping. This makes learning deliberate rather than anecdotal.
🧮 Use Models That Match the Decision
A model need only be accurate enough for its purpose. A first-principles simulation can be valuable for a major redesign, while a mass balance, heat balance, or empirical trend may be better for screening daily operating changes.
Beware of false precision. A model output with several decimal places does not make uncertain feed properties, fouling factors, or kinetics more certain. State assumptions clearly and test the conclusions against plant observations.
Simple models are often easier to maintain, explain, and challenge. Their role is to sharpen engineering judgment, not to replace it.
🧑🔧 Bring Operations and Maintenance Together
Efficiency and reliability are deeply connected. A leaking valve, degraded exchanger, worn pump, or unstable transmitter can create energy loss and variability long before it causes an obvious failure.
Maintenance teams need operating context: when the issue appears, what process conditions worsen it, and what production consequence it has. Operations teams need to understand the limits of equipment condition and temporary repairs.
Joint reviews of chronic losses can prevent the familiar cycle in which operations compensate for equipment problems and that compensation masks the problem from maintenance planning.
🛡️ Keep Safety and Safeguards Outside the Trade-Off
Efficiency work must never weaken protective layers, bypass interlocks, defeat alarms, or normalize operation beyond approved limits. A utility-saving change that reduces cooling margin or relief-system adequacy is not a legitimate optimization.
Any change affecting chemistry, pressure, temperature, composition, control logic, equipment duty, or operating procedures may require formal management of change. The necessary review depends on the site and the nature of the change.
Involve process safety, operations, maintenance, and technical specialists early. Their questions often reveal interactions that a narrowly economic analysis misses.
🧪 Run Small, Reversible Tests
When uncertainty is meaningful, test at limited scale and duration within approved boundaries. Change one principal variable at a time where possible, wait for relevant process delays, and compare against a suitable baseline.
For a hypothetical evaporator, a team might test a modest change in feed preheat while tracking steam demand, condensate temperature, product concentration, pressure stability, and fouling indicators. A lower steam rate is not a success if concentration control deteriorates.
Document both expected and unexpected results. Negative results can save substantial time by ruling out appealing but ineffective ideas.
💰 Rank Opportunities by Effort and Confidence
A practical opportunity register prevents teams from pursuing only the most visible idea. Record the loss mechanism, likely benefit, required investment, operational risk, data quality, owner, and next validation step.
Start with actions that are safe, reversible, inexpensive, and supported by evidence: repairing leaks, restoring instrumentation, correcting bypasses, tuning a troubled loop, or standardizing a transition. Larger projects can follow when the residual constraint is clear.
This sequencing avoids a common error: installing hardware to compensate for a problem that better measurement or operating discipline would have solved.
📚 Learn from Deviations Without Blame
Near-misses, off-spec batches, unusual utility use, and unstable shifts contain process information. A useful review asks what conditions preceded the event, which signals changed first, what barriers worked, and what made recovery difficult.
Blame tends to produce vague conclusions such as “be more careful.” Better learning identifies a missing indicator, an ambiguous procedure, a weak control response, an equipment limitation, or an unrealistic target.
Capture the lesson in a form people can use: a trend example, revised operating window, troubleshooting guide, maintenance task, or training scenario.
🌱 Consider Emissions, Water, and Waste Together
Resource efficiency often aligns with environmental performance, but not automatically. Lower steam use may reduce fuel demand, while an aggressive purge reduction may increase impurity buildup or create more difficult waste elsewhere.
Consider the destination of each avoided loss. Does it become recovered product, lower utility use, less wastewater, reduced venting, or simply a transfer to another process area? The answer determines whether the improvement is genuinely system-wide.
Environmental gains are strongest when they come from stable operation, good recovery, leak prevention, and avoiding unnecessary heating, cooling, and reprocessing.
🧱 Know When Simplicity Has Reached Its Limit
Operational improvements cannot repeal physical limits. An exchanger with insufficient area, a compressor at its safe operating boundary, a column lacking separation stages, or a treatment system at capacity may require capital investment.
The value of the smarter path is that it produces a stronger capital case. Once controls are healthy, measurements are credible, and operating windows are understood, engineers can show what constraint remains and what equipment change would remove it.
That is far better than adding complexity based on symptoms. It also helps specify equipment that fits the real duty rather than an inflated allowance for unmanaged variation.
🧭 Build a Repeatable Improvement Routine
Improvement is most effective when it becomes part of normal work rather than a one-time campaign. A regular review can connect daily observations with engineering analysis and maintenance action.
- Choose one value-relevant loss or active constraint.
- Verify the measurements and create a baseline over representative operation.
- State a physical hypothesis for the loss mechanism.
- Assess safety, quality, and operational boundaries before acting.
- Test the least complex credible change and measure the whole-system result.
- Standardize what works, monitor it, and revisit the next constraint.
This routine creates a feedback loop: better understanding improves stability, stability reveals the true bottleneck, and the true bottleneck guides the next investment.
🏁 The Core Principle: Remove Uncertainty Before Adding Complexity
The most durable efficiency gains often come from making the existing process easier to see and easier to control. Reliable measurements, sound balances, stable utilities, healthy control loops, defined operating windows, and disciplined transitions reduce the uncertainty that forces plants to operate conservatively.
This approach is not an argument against new technology or capital equipment. It is a method for using them wisely. When a process is understood, teams can distinguish a genuine physical limitation from a solvable problem of variation, maintenance, control, or coordination.
In practice, the question changes from “What can we add?” to “What is making the current plant work harder than necessary?” That question is often where meaningful process efficiency begins.
Improve the clarity, stability, and discipline of the process first; add complexity only when the evidence shows that the existing system has reached a real limit. 🧪⚙️🌱