
A production line can be running smoothly, orders can be shipping on time, and the waste container can still be filling faster than anyone expects. Off-spec batches, spilled powders, purge streams, rejected packaging, and valuable product left in pipes may each seem like a routine cost of doing business.
But waste is often a process signal. It can reveal a mismatch between operating conditions and material behavior, a poorly controlled handoff between unit operations, or a decision made without seeing its downstream consequences.
For chemical engineers, reducing industrial waste is not simply a disposal problem. It is a design, operations, measurement, and control problem. The most effective solutions prevent materials from becoming waste in the first place.
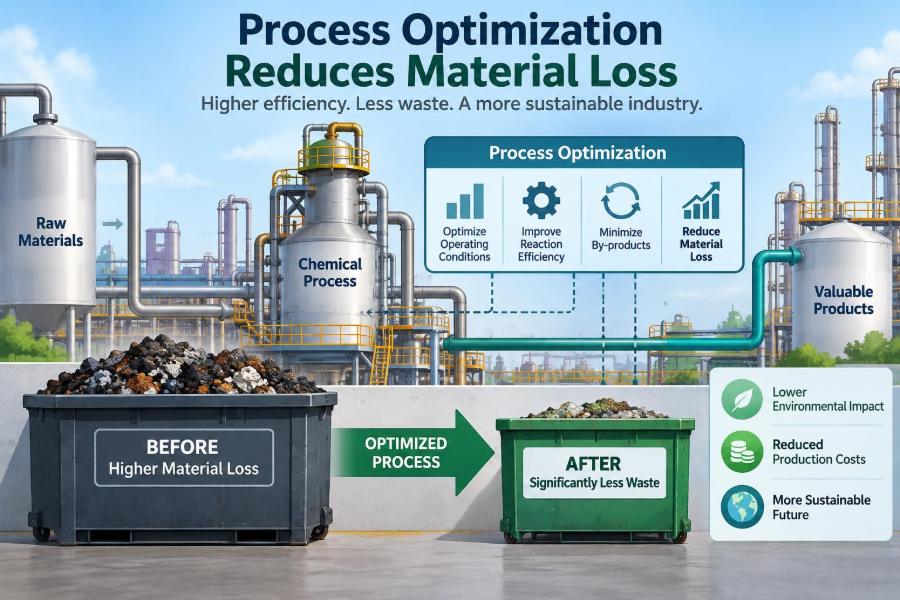
Process optimization provides the framework: understand where losses occur, identify what causes them, test changes safely, and hold the improved conditions over time. The result can be lower raw-material use, less treatment burden, and a more reliable plant.
🔍 What Industrial Waste Really Includes
Industrial waste includes more than drums sent to a disposal contractor. It includes any material purchased, produced, or processed that does not become intended saleable product or a useful internal resource.
That definition captures solids, liquids, gases, energy-bearing streams, and material trapped in equipment. A solvent recovery still-bottom, a contaminated rinse, or product remaining after a line change can all represent material loss.
📉 Why Material Loss Matters to Process Economics
Material loss has a double cost. The plant pays for feedstock that does not become product, then often pays again to separate, treat, store, transport, or dispose of the resulting stream.
Losses can also constrain throughput. A reactor that produces too much off-spec material or a filter that frequently blinds may force production slowdowns, cleaning work, and delayed orders. Reducing waste therefore improves both yield and operating stability.
⚖️ The Material Balance as a Starting Point
A material balance accounts for what enters, leaves, accumulates, reacts, and is lost in a defined process boundary. Its simplest form is: input equals output plus accumulation plus loss, with reaction terms considered when chemistry changes the species present.
Balances turn a vague complaint—“we are wasting too much solvent”—into a solvable question. How much enters? Which outlets carry it? Is it evaporating, retained in solids, sent to wastewater, or left in equipment?
Before proposing improvements, engineers need a balance period and boundary that match the problem. A daily plant balance may hide a large loss that happens only during a weekly grade change.
🗺️ Mapping the Full Material Journey
A process flow diagram shows major unit operations, but waste mapping needs more detail. Trace a material from receiving through storage, transfer, reaction, separation, finishing, packaging, cleaning, and waste handling.
Mark normal streams as well as intermittent ones: startup discharges, sample returns, maintenance drains, tank heel removal, and emergency relief pathways. These “small” streams can be material-intensive because they are often poorly measured.
- Where is material intentionally removed?
- Where can contamination make material unrecoverable?
- Where are streams mixed before their value is assessed?
- Where does product remain after a campaign ends?
🧪 Yield Is Not the Same as Conversion
Conversion describes how much of a reactant has reacted. Yield describes how much desired product is obtained relative to the theoretical or practical basis. A high conversion does not guarantee a high yield if side reactions form by-products.
This distinction matters in optimization. Raising temperature or extending residence time may consume more feed, yet lower desired-product yield by accelerating degradation or unwanted reactions. The best operating point is usually a trade-off, not the maximum of one variable.
🌡️ Reaction Conditions Create or Prevent Waste
Temperature, pressure, concentration, mixing, catalyst condition, pH, and residence time shape reaction selectivity. Small variation can matter when a process has a narrow operating window.
For example, an exothermic reaction with uneven mixing may develop local hot spots. Even if the average reactor temperature looks acceptable, those zones can produce impurities that require rework or cause the entire batch to fail specification.
Optimization begins by identifying which variables directly influence selectivity and which are merely convenient indicators.
🌀 Mixing Problems Hide in Plain Sight
Poor mixing can create concentration gradients, incomplete reactions, inconsistent particle size, and local overheating. These effects are especially common when a process is scaled from laboratory equipment to a much larger vessel.
Agitator speed alone is not a complete mixing description. Impeller type, liquid level, viscosity, baffles, feed location, gas dispersion, and addition rate all affect what materials experience inside the vessel.
A useful investigation compares waste events with operating conditions during additions, not only with the final recorded batch averages.
⏱️ Residence Time Distribution Changes Product Quality
In continuous equipment, not every fluid element spends exactly the average residence time in a reactor, dryer, or separator. The spread of times is called the residence time distribution.
Short-circuiting can send underprocessed material downstream, while stagnant zones can overexpose material to heat or reaction. Both outcomes generate losses even when the nominal residence time seems correct.
Tracer testing, equipment inspection, and flow modeling can help reveal these patterns, but the appropriate method depends on the process hazard and the consequences of intervention.
🧹 Startup, Shutdown, and Changeover Losses
Steady-state performance can look excellent while transitions generate most of the waste. Startup material may not meet specification until temperatures, flows, and concentrations stabilize. Shutdown can leave valuable inventory in lines and vessels.
Grade changes add another challenge: residual material can contaminate the next product. Plants may use flushing, purging, or disposal to manage that risk, but each method has a cost.
Better sequencing, defined transition targets, smaller hold-up volumes, and recovery of compatible transition material can reduce losses without compromising quality.
🚰 Water Use Often Becomes Wastewater Load
Water is frequently used for washing, dilution, steam generation, cooling, and cleaning. Once it contacts salts, solvents, product residues, or oils, it may require treatment before discharge or reuse.
Reducing wastewater does not mean indiscriminately using less water. Insufficient washing can cause contamination, corrosion, or product failures. The aim is to use the right water quality, at the right point, in the right amount.
Counter-current washing is a common principle: cleaner water contacts the cleanest material last, while progressively dirtier water is used earlier where high purity is unnecessary.
🔄 Separate Streams Before They Become Hard to Recover
A relatively clean solvent stream may be recoverable, while the same solvent mixed with oils, salts, pigments, or multiple organics may be expensive to separate. Once streams are combined, their treatment difficulty usually increases.
Segregation is therefore an optimization strategy, not merely a housekeeping rule. Dedicated drains, clear labeling, compatible collection systems, and operating discipline preserve recovery options.
| Stream condition | Likely optimization focus | Main caution |
|---|---|---|
| Relatively clean, known composition | Reuse or recovery | Verify impurity buildup |
| Intermittent concentrated stream | Capture and batch treatment | Provide safe surge capacity |
| Dilute mixed wastewater | Source reduction and segregation | Do not disrupt treatment biology or chemistry |
| Contaminated solids | Improve filtration, washing, or handling | Assess worker exposure and dust risk |
♻️ Solvent Recovery Has a Practical Limit
Distillation, adsorption, membrane systems, and other recovery methods can return solvents to service. Whether recovery is sensible depends on composition, contamination, energy demand, purity requirements, and the effect of impurities on the next process use.
Recovery is not automatically preferable to prevention. A process redesign that avoids a difficult solvent or reduces its required volume may outperform a highly energy-intensive recovery system.
Recovered solvent also needs a quality specification. Without one, a recovery loop can gradually introduce contaminants that create more off-spec product than it saves.
🧱 Equipment Hold-Up Is Inventory You May Lose
Hold-up is material retained in pipes, pumps, filters, vessels, and transfer lines after normal drainage. In a high-value product process, even a modest volume becomes significant across repeated batches.
Low points, dead legs, long transfer lines, oversized vessels, and poorly sloped piping can all increase hold-up. Design changes such as drainable geometry, piggable pipelines, appropriate pipe sizing, and strategically located recovery connections can help.
Any modification must be reviewed for cleanability, pressure safety, contamination control, and maintenance access—not just recovered volume.
📦 Packaging Loss Is Part of Process Performance
Waste reduction sometimes stops at the plant gate, yet filling and packaging can reject otherwise good product. Overfills, damaged containers, label errors, poor seals, and inaccurate check-weighing create material loss and potential customer complaints.
Filling equipment should be optimized alongside upstream processes. Stable product temperature, viscosity, foam behavior, and feed pressure can be as important as the filler’s mechanical settings.
📊 Measure the Right Loss Indicators
Plants often track total waste mass, but that number can conceal useful information. A larger amount of low-hazard water may be less urgent than a small loss of expensive feedstock or a stream that destabilizes wastewater treatment.
Useful indicators can include:
- Raw material used per unit of saleable product
- First-pass yield and rework rate
- Off-spec material by cause category
- Solvent loss per batch or campaign
- Wastewater contaminant load per unit production
- Transition waste during startup or grade change
Normalize indicators to production volume when appropriate, while still watching absolute quantities that affect storage capacity or permits.
📡 Reliable Data Comes Before Advanced Optimization
A dashboard cannot correct a faulty flowmeter, an unrepresentative sample, or a spreadsheet that combines incompatible categories. Data validation is a core engineering task.
Check calibration status, sensor range, sampling location, laboratory methods, timestamp alignment, and manual entry practices. Reconcile measurements against material balances to identify gaps.
When data are uncertain, state that uncertainty. An approximate loss estimate can still guide investigation, but it should not be treated as a precise design basis.
🧠 Find Root Causes Instead of Treating Symptoms
Adding a larger waste tank may solve an immediate capacity problem, but it does not explain why the stream increased. Root-cause analysis asks what physical, chemical, mechanical, or organizational condition produced the loss.
Useful tools include cause-and-effect diagrams, event timelines, five-whys questioning, mass balances, and comparison of successful versus failed batches. The goal is evidence, not a favored explanation.
For example, repeated filter cake losses may arise from poor crystallization control, incorrect wash sequence, damaged filter media, or an unrealistic production schedule. Each cause demands a different remedy.
🧩 Design of Experiments Makes Testing More Efficient
When several variables may influence waste, changing one factor at a time can be slow and misleading. Design of experiments, often shortened to DOE, is a structured way to test multiple factors and their interactions.
A well-designed trial might examine how temperature, feed ratio, and agitation jointly affect impurity formation. It can identify interactions that isolated trials miss, such as a temperature setting that is acceptable only at a particular concentration.
Trials must respect safety limits, quality requirements, and production constraints. Statistical significance does not override process safety or product acceptance criteria.
🎛️ Control Strategies Keep Improvements From Drifting
An optimized setpoint is useful only if the plant can maintain it. Feedback control adjusts a manipulated variable based on a measured deviation, such as changing steam flow to hold temperature.
More advanced strategies may anticipate disturbances, coordinate several variables, or use models of process behavior. Their value depends on having trustworthy sensors, stable actuators, and a clear understanding of the process.
Sometimes the best improvement is simpler: a standard addition rate, a visible operating limit, or an alarm that detects an abnormal trend before a batch is lost.
🛠️ Preventive Maintenance Protects Yield
Worn seals, fouled heat exchangers, leaking valves, misaligned pumps, and degraded instruments can quietly increase material loss. The waste may appear as evaporation, contamination, inconsistent temperature control, or repeated cleaning.
Maintenance priorities should reflect process consequences. A small leak on a utility line differs from a small leak of a hazardous or high-value material. Critical equipment lists help focus limited maintenance resources.
👷 Operators Hold Essential Process Knowledge
Operators see changes that may not appear in historians: a pump sound, unusual foam, a valve that sticks, or a batch that “feels” different during transfer. This knowledge is valuable when it is captured respectfully and checked against data.
Waste-reduction projects work better when operating crews help define practical changes. A theoretically efficient procedure that adds unsafe steps, excessive workload, or ambiguous decisions is unlikely to remain effective.
Clear standard operating procedures should explain not only what to do, but why a limit or sequence matters.
🧤 Safety and Environmental Controls Set Boundaries
Waste minimization must never encourage unsafe shortcuts. Reducing a purge, wash, or vent without understanding its safety function can increase fire, exposure, overpressure, contamination, or runaway-reaction risks.
Changes should pass through the site’s management-of-change process where applicable. That review considers hazards, safeguards, training, operating documents, environmental obligations, and the need for testing before full implementation.
The right question is not “Can we eliminate this stream?” but “What function does it serve, and can that function be achieved with less loss?”
🏭 Process Integration Looks Beyond One Unit
A local improvement can shift waste elsewhere. Increasing evaporation may reduce liquid wastewater volume but concentrate contaminants, increase energy use, or create a difficult solid residue.
Process integration examines heat, water, material, and utility flows across the system. Reusing warm water, recovering condensate, or routing a compatible by-product to another internal use may reduce total burden when quality and safety requirements are met.
System thinking prevents a plant from celebrating a reduction in one department while creating a larger problem downstream.
🌿 Source Reduction Beats End-of-Pipe Treatment
End-of-pipe treatment—such as neutralization, biological treatment, incineration, or landfill preparation—remains necessary for many streams. It protects people and the environment when prevention is not feasible.
Yet treatment generally manages waste after materials have already lost value. Source reduction addresses formulation, reaction route, equipment design, operating practice, and purchasing specifications so less waste is created.
The practical hierarchy is to prevent where possible, reduce what cannot be prevented, recover useful value where justified, and treat residuals responsibly.
💰 Build a Business Case With Total Cost
Disposal fees alone rarely capture the value of a waste-reduction project. Include lost feedstock, lost product margin, utilities, labor, analytical testing, cleaning, downtime, storage, transport, and treatment impacts.
A project may also require capital, validation work, controls upgrades, training, and ongoing maintenance. Presenting both benefits and implementation costs makes the proposal more credible.
Not every project will have the same payback. Some are justified primarily by risk reduction, compliance resilience, or improved operational reliability.
🧭 Prioritize Opportunities Rationally
A plant can identify dozens of loss points, so prioritization matters. A simple matrix can rank opportunities by material value, environmental hazard, frequency, technical feasibility, capital requirement, safety impact, and confidence in the available data.
Quick wins—such as fixing an obvious transfer leak or improving a rinse sequence—can build momentum. Larger projects, such as changing separation technology, need stronger design evidence and longer planning.
A balanced portfolio avoids spending all attention on easy but minor issues while ignoring a difficult, high-consequence stream.
🧫 A Hypothetical Example: Reducing Product in Filter Cake
Consider a hypothetical specialty-chemical plant where valuable dissolved product leaves a filter with wet solids. The plant initially proposes adding more wash solvent to recover more product.
A broader investigation finds that the cake thickness varies widely, wash distribution is uneven, and the added solvent increases downstream recovery load. The team tests a more consistent filtration endpoint, an adjusted wash sequence, and improved flow distribution.
The preferred solution would depend on product purity, solvent compatibility, equipment limits, and economic evaluation. The lesson is that more washing is not automatically better; the separation mechanism must be understood first.
⚠️ Common Optimization Mistakes
Several habits repeatedly undermine good intentions:
- Optimizing one unit operation while ignoring downstream impacts
- Using average data that hide batch-to-batch variation
- Counting rework as success without accounting for its energy and capacity cost
- Mixing recoverable streams with incompatible wastes
- Installing complex controls before fixing basic measurement problems
- Changing procedures without training the people who execute them
- Reducing safety-related purges or washes without hazard review
These mistakes are avoidable when projects combine engineering analysis with operational reality.
📝 Turning Findings Into a Sustained Program
One successful trial is not a waste-minimization program. Sustained performance requires ownership, documented settings, routine review, maintenance support, and a way to investigate deviations.
Define who monitors each indicator, how often results are reviewed, what level triggers action, and who has authority to change the process. Record the basis for the optimized condition so later teams do not unknowingly reverse it.
Continuous improvement works best as a cycle: measure, understand, test, standardize, verify, and revisit when feedstocks, equipment, demand, or regulations change.
🎓 Skills That Help Engineers Reduce Waste
The technical foundation includes mass and energy balances, thermodynamics, reaction engineering, transport phenomena, separations, process control, and statistics. Equally useful are communication, observation, project planning, and the ability to ask precise questions on the plant floor.
For students, a useful exercise is to take a familiar process—coffee brewing, paint mixing, water treatment, or tablet coating—and identify inputs, desired outputs, off-spec material, hold-up, and opportunities for recovery. The same reasoning scales to industry.
🔑 The Core Principle: Waste Is a Process Outcome
Industrial waste is rarely explained by one careless act or one piece of equipment. It emerges from a system of material choices, equipment geometry, operating conditions, measurements, controls, transition practices, and decisions about acceptable variability.
Process optimization reduces material loss by making those relationships visible and manageable. It asks where value disappears, why it disappears, and which change prevents the loss without simply moving risk or pollution to another stream.
The strongest solutions combine sound engineering with safe implementation: accurate balances, well-designed trials, operator involvement, lifecycle thinking, and disciplined follow-through.
The most sustainable waste is the material that never becomes waste because the process was designed and operated to keep it in productive use. That is the practical promise of process optimization for chemical engineering. 🧪♻️