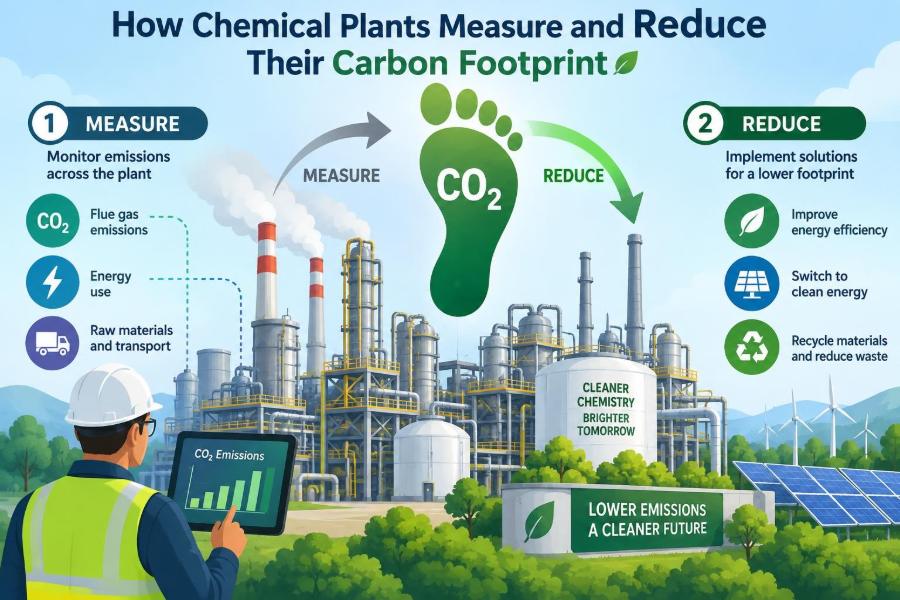

A process engineer reviews the morning dashboard before a production meeting. Steam demand rose overnight, a boiler changed fuel mix, and a compressor train consumed more electricity than expected. None of those readings says “carbon footprint” by itself, but together they determine it.
For chemical plants, emissions accounting is not simply an annual reporting exercise. It is a way to understand how molecules, heat, power, equipment, and operating decisions create climate impacts across a process.
This matters to plant teams because carbon performance increasingly affects energy costs, project approvals, customer expectations, and long-term competitiveness. It also matters because the biggest reduction opportunities are often hidden inside ordinary engineering choices.
A credible footprint starts with sound boundaries and reliable data. Useful reductions follow when engineers turn that footprint into practical changes in energy use, feedstocks, utilities, and product design. 🌍
🧭 1. What a Carbon Footprint Means for a Chemical Plant
A plant’s carbon footprint is the total greenhouse-gas impact associated with its activities over a defined period. It is usually expressed as carbon dioxide equivalent, written as CO₂e.
CO₂e allows gases with different warming effects to be reported on one common basis. Carbon dioxide is important, but methane, nitrous oxide, fluorinated gases, and other greenhouse gases may also be relevant in chemical operations.
⚖️ 2. Why CO₂e Is Used Instead of Carbon Dioxide Alone
Greenhouse gases do not absorb heat in the atmosphere equally or remain there for the same length of time. Converting them to CO₂e uses published global-warming-potential factors for a specified time horizon.
The chosen factors and reporting method should be stated clearly. A footprint is only comparable when its calculation basis, boundary, and time period are known.
🏭 3. Identify the Plant’s Major Emission Sources First
Most sites have a relatively small number of dominant sources. A first inventory should map fuels, purchased energy, process vents, flares, refrigerants, waste treatment, transport, and significant material inputs.
- Boilers, furnaces, turbines, and thermal oxidizers
- Grid electricity, imported steam, and chilled utilities
- Reaction by-products and process gas streams
- Fugitive releases from valves, seals, tanks, and refrigeration systems
- Purchased feedstocks, packaging, and outbound logistics
This map is not yet a calculation; it is the engineering picture that makes the calculation defensible.
🔲 4. Set Organizational Boundaries
Before adding numbers, decide which facilities and activities belong to the organization’s inventory. A company may own a site, operate it for another party, or share utilities with neighboring facilities.
The boundary should consistently reflect the selected accounting approach. Joint ventures, leased assets, tolling arrangements, and shared power plants deserve particular attention because responsibility can otherwise be counted twice or not at all.
📍 5. Set Operational Boundaries with Scopes
Operational emissions are commonly grouped into Scope 1, Scope 2, and Scope 3. The categories help teams distinguish direct releases from impacts connected to purchased energy and the value chain.
| Category | Typical chemical-plant examples |
|---|---|
| Scope 1 | Fuel combustion, process emissions, flaring, and refrigerant leaks from sources controlled by the site |
| Scope 2 | Emissions associated with purchased electricity, steam, heating, or cooling |
| Scope 3 | Purchased materials, capital goods, transport, waste, product use, and end-of-life treatment |
Scopes are useful categories, not substitutes for process understanding. A site can reduce Scope 1 while shifting emissions to its electricity supplier or upstream feedstock producer.
🔥 6. Measure Direct Fuel Combustion
Combustion emissions usually begin with measured fuel use: natural gas, fuel gas, fuel oil, coal, biomass, or other fuels. Meters, purchase records, tank inventories, and heating values can provide the activity data.
A basic calculation has the form emissions = fuel consumed × emission factor. Depending on the method, oxidation, fuel composition, and gases other than CO₂ may also be included.
Fuel gas deserves care because its composition can change with process conditions. Using an assumed constant composition when the stream varies significantly can distort both energy and emissions results.
🧪 7. Separate Process Emissions from Energy Emissions
Some emissions arise because chemistry produces or releases a greenhouse gas, not because a fuel was burned. Examples include carbon dioxide released during calcination or reforming-related processes, nitrous oxide from certain reaction pathways, and gases vented during purification.
These process emissions often require mass balances, analyzer data, stoichiometric calculations, or specific measurement systems. They cannot always be estimated accurately from plant energy consumption.
⚡ 8. Account for Purchased Electricity
Purchased electricity can be one of the largest footprint components, especially in electrochemical production, compression-heavy plants, and sites with electrically driven refrigeration. The calculation combines electricity use with an appropriate emission factor.
Teams should retain interval data when available. It can reveal how electricity demand coincides with production rates, peak pricing, renewable generation patterns, or equipment operating modes.
🌡️ 9. Include Imported and Exported Utilities
Industrial sites may import steam, hot oil, cooling, compressed air, nitrogen, or refrigeration from a central utility system. These utilities carry upstream emissions even if no fuel is burned inside the process unit.
Exported electricity or steam also needs a transparent treatment. Avoid casually subtracting exports without documenting the accounting method and preventing double counting with the receiving facility.
💨 10. Find Fugitive Emissions
Fugitive emissions are unintended releases from equipment and storage systems. Methane leaks, refrigerant losses, volatile process gases, and leaks from pressurized systems can be important even when their mass is small.
Leak detection and repair programs, maintenance records, material balances, and refrigerant service logs all provide valuable evidence. The same program that improves safety and product recovery can improve emissions data quality.
🔥 11. Treat Flaring as a Process Problem, Not a Default
Flares protect people and equipment by safely disposing of gases during startups, shutdowns, upsets, and emergency conditions. They are essential safeguards, but routine flaring often signals recoverable energy or material losses.
Track flare flow, composition, duration, pilot use, and operating cause. Classifying events helps engineers distinguish unavoidable safety events from repeated operational, control, capacity, or maintenance problems.
🗃️ 12. Build a Practical Data System
A robust inventory is built from traceable source data rather than a last-minute spreadsheet. Each important data point should have an owner, frequency, unit, data source, validation step, and documented calculation.
- Fuel meters and utility invoices
- Distributed control system histories
- Laboratory composition results
- Maintenance and leak-repair records
- Production, shipment, and waste manifests
Automation can reduce manual errors, but it cannot correct a poorly located meter or an unclear process boundary.
✅ 13. Check Data Quality Before Drawing Conclusions
Data quality means more than having a number. Engineers should ask whether the number is complete, representative, timely, consistent in units, and plausible compared with process balances.
Reconcile fuel use with boiler duty, electricity consumption with major motor loads, and feedstock use with production. Large unexplained differences are often clues to metering gaps, inventory changes, or incorrect assumptions.
📐 14. Choose Meaningful Intensity Metrics
Total annual emissions show the plant’s absolute impact, while emissions intensity relates emissions to useful output. Both are needed because a production increase can raise total emissions while improving energy efficiency per tonne of product.
Useful denominators depend on the plant: tonnes of saleable product, tonnes of active ingredient, gigajoules of product energy, or another functional measure. The denominator should not hide changes in product quality or yield.
🧮 15. Use Mass and Energy Balances
Chemical engineers already use balances to understand process performance. The same discipline supports carbon accounting by following carbon-containing materials, fuel energy, vent streams, and utility demands through the plant.
A carbon balance can expose missing streams or implausible emissions estimates. An energy balance can identify where heat leaves in stack gases, cooling water, condensate, or inefficient utility generation.
🧱 16. Understand Scope 3 without Losing Focus
Scope 3 includes indirect value-chain emissions outside the plant’s direct control. For many chemical products, upstream feedstocks can dominate because producing basic chemicals, solvents, metals, or specialty ingredients requires substantial energy.
Start with screening-level estimates to identify material categories. Then improve the data for the largest contributors rather than spending equal effort on every minor purchase.
🚚 17. Consider Transport, Packaging, and Distribution
Transport impacts depend on distance, mode, load factor, fuel, and product form. Shipping concentrated product can reduce freight per unit of useful chemical, but concentration may introduce handling, viscosity, corrosion, or safety constraints.
Packaging choices also involve trade-offs. Reusable containers, lighter materials, recycled content, and improved filling practices can help, but only when the full logistics system supports them.
🔄 18. Apply Life-Cycle Thinking to Products
A plant-gate footprint is valuable, but it does not answer every product question. Life-cycle thinking considers upstream raw materials, manufacturing, use, and end-of-life stages.
For example, a chemical may require energy to manufacture but enable lower energy use in insulation, water treatment, coatings, or lightweight materials. Claims about such benefits require an appropriate functional comparison and clearly stated assumptions.
🎯 19. Establish a Credible Baseline
A baseline is the reference against which progress is measured. Select a period with sufficiently complete data and document unusual conditions such as outages, abnormal feedstock quality, major construction, or exceptional product mix.
Do not quietly change the baseline whenever performance worsens. If a recalculation is necessary after a major structural change, explain why and apply the method consistently.
📊 20. Create an Emissions Hotspot Map
Hotspot analysis ranks sources by their contribution and shows where action is likely to matter most. It should combine emissions magnitude with technical feasibility, cost, operational risk, and project timing.
A useful map may show that a few furnaces dominate direct emissions, while purchased electricity dominates a separate unit and a single feedstock dominates product life-cycle intensity. That insight directs engineering attention. 🔎
🛠️ 21. Reduce Energy Demand before Changing Energy Supply
Efficiency is often the first reduction lever because it lowers fuel or electricity use regardless of the supply source. It can also reduce operating cost and improve capacity or reliability.
Common engineering opportunities
- Repair steam leaks, insulate hot surfaces, and return clean condensate
- Improve furnace excess-air control and maintain heat-transfer surfaces
- Optimize distillation reflux, pressure, and heat integration
- Use variable-speed drives where flow control otherwise wastes energy
- Reduce compressed-air leaks and inappropriate air use
Every project should verify that product quality, safety margins, and operability remain acceptable.
♨️ 22. Improve Heat Integration
Heating and cooling loads frequently coexist in chemical processes. Heat integration seeks to transfer heat from streams that need cooling to streams that need heating, reducing external utility demand.
Pinch analysis and heat-exchanger network studies can identify opportunities, but implementation must account for fouling, controllability, pressure drop, batch scheduling, and maintenance access. A theoretically attractive exchanger is not automatically a reliable plant modification.
🔌 23. Electrify Where It Delivers a Real Benefit
Electrification can replace direct combustion with electric boilers, heat pumps, electric heaters, or electrically driven equipment. Its climate benefit depends on the electricity source, efficiency, load profile, and displaced fuel.
High-temperature duties may be technically challenging, while low- and medium-temperature heating can offer more immediate options in some settings. Grid constraints and electrical infrastructure are central design considerations.
☀️ 24. Procure Lower-Carbon Energy Carefully
Plants may reduce electricity-related emissions through on-site generation, power-purchase arrangements, or other supply contracts, subject to local markets and rules. Claims should match the contractual instrument and the physical or market-based accounting method used.
Lower-carbon electricity does not eliminate the need for demand management. A more efficient plant needs less generation capacity, fewer upgrades, and often has greater operating flexibility.
🧬 25. Change Feedstocks and Process Routes
Some of the largest long-term reductions require changing the chemistry itself. Options can include recycled feedstocks, bio-based inputs, alternative reductants, lower-carbon hydrogen, carbon capture, or new catalytic routes.
These changes require rigorous assessment of availability, purity, trace contaminants, land-use implications where relevant, lifecycle effects, and compatibility with existing assets. “Renewable” is not automatically synonymous with low footprint.
🧯 26. Prevent Waste and Recover Valuable Materials
Yield losses create a double penalty: emissions were incurred to make material that is not sold, and additional treatment may be needed for the waste. Better selectivity, recovery, segregation, and reuse can therefore reduce both cost and footprint.
Solvent recovery, purge minimization, off-spec rework, catalyst life extension, and by-product valorization are examples where process optimization and circularity can overlap.
📈 27. Turn Targets into Operating Management
A target becomes useful when it is connected to unit-level actions, capital plans, responsibilities, and verification. Plant leaders should distinguish between a projected reduction from a project and a measured reduction after it operates.
Include carbon indicators in routine operating reviews alongside safety, quality, throughput, maintenance, and cost. This prevents carbon work from becoming a separate report disconnected from day-to-day decisions.
🔍 28. Verify, Report, and Communicate Transparently
Internal review, independent assurance where appropriate, and clear records improve confidence in reported results. Report both achievements and material limitations, including estimates, data gaps, and changes in calculation methods.
Transparency is especially important when communicating product footprints. State the functional unit, system boundary, allocation approach, key assumptions, and whether results are based on measured primary data or secondary estimates.
🌱 29. The Core Principle: Measure to Manage, Then Redesign
The central principle is simple: measure emissions with the same engineering rigor used for mass, energy, quality, and safety, then use the results to redesign the system. A carbon inventory identifies where emissions occur; engineering determines which changes genuinely reduce them.
Start with clear boundaries, credible activity data, and hotspot analysis. Prioritize efficiency and loss prevention, evaluate energy and feedstock changes across the lifecycle, and verify performance after implementation.
The most effective carbon strategy is not a single technology—it is a continuous cycle of measurement, process understanding, and disciplined improvement. 🌍⚙️🌱