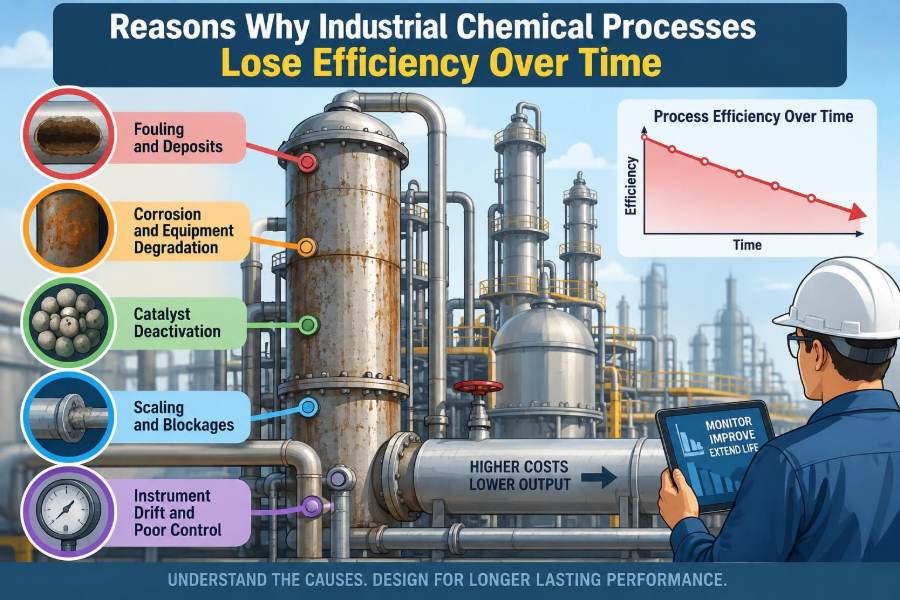

A process unit can meet its production target for years and still be quietly losing performance. Steam demand rises, pressure drop creeps upward, product specifications become harder to hold, or operators need increasingly frequent adjustments to keep the plant stable.
None of these changes necessarily begins as a dramatic failure. More often, a process slowly moves away from the clean, well-controlled conditions assumed in its design calculations. The result may be higher energy use, lower yield, more waste, reduced throughput, or a narrower operating margin.
For students, this is a useful reminder that a process flow diagram describes an intended system, not a permanently fixed reality. For working professionals, understanding gradual efficiency loss helps distinguish ordinary variation from degradation that deserves investigation.
Industrial chemical processes lose efficiency for many connected reasons: material changes, equipment aging, control limitations, fouling, heat losses, and operating decisions. The key is to identify the physical mechanism before choosing a remedy.
🔎 What “Efficiency” Means in a Process Plant
Efficiency is not one universal number. In a reactor, it may mean conversion, selectivity, or yield. In a distillation column, it may mean separation quality per unit of steam and reflux. In a utility system, it may mean how much useful heating, cooling, or shaft work is obtained from each unit of energy supplied.
A unit can appear productive while becoming less efficient. For example, a plant may maintain output by increasing furnace firing, recycle flow, or compressor power. Production has not fallen yet, but the process requires more resources to achieve the same result.
Good performance monitoring compares output, quality, energy, raw-material use, and operating constraints together. Looking at only one variable can hide the real loss.
📉 Why Performance Usually Declines Gradually
Many degradation mechanisms accumulate slowly. A thin deposit in a heat exchanger, slight catalyst deactivation, or incremental valve wear may have little visible effect at first. Over months, several small penalties can combine into a meaningful loss.
Gradual decline is also easily normalized. If each operator inherits a slightly higher steam setting or a slightly different control target, the new condition can become routine before anyone compares it with the original baseline.
Trend data are more revealing than isolated readings. A single high pressure drop can result from a temporary upset; a steady rise at comparable throughput and temperature points to a changing system.
🧭 Design Conditions Are Not Daily Operating Conditions
Design cases use assumptions about feed composition, ambient conditions, equipment cleanliness, utility availability, and product requirements. Real plants operate through feedstock variability, seasonal weather, maintenance constraints, and changing production schedules.
That does not mean the design was wrong. It means equipment has a practical operating envelope. A cooling tower designed around one wet-bulb temperature, for instance, will provide less cooling on a hot, humid day even if every component works correctly.
Efficiency analysis should therefore compare performance with an appropriate reference condition, not simply with an ideal nameplate value.
🧪 Feedstock Composition Drift
Feedstocks are often mixtures, and their composition can shift between suppliers, wells, batches, or storage tanks. A modest change in water, sulfur, salts, heavy ends, inert gases, or trace contaminants can alter reaction rates, separation loads, corrosion risk, and utility demand.
Consider a hypothetical solvent-recovery unit receiving a feed with more high-boiling impurities than usual. The reboiler may need more duty, the column may approach flooding sooner, and product purity may become harder to maintain. The equipment has not necessarily degraded; its duty has changed.
Reliable sampling plans and laboratory results turn “the feed seems different” into a testable explanation. Feed-forward control or revised operating targets may be needed when variability is persistent.
💧 Water, Salts, and Trace Contaminants
Small impurities can produce disproportionately large problems. Water may dilute reactants, shift equilibria, promote hydrolysis, or increase distillation duty. Chlorides and other salts can cause deposits, corrosion, and catalyst damage depending on the process chemistry.
Trace poisons are especially significant in catalytic systems. Sulfur compounds, metals, phosphorus species, or other contaminants can bind to active sites or alter catalyst surfaces. The relevant contaminant depends on the catalyst and reaction, so generic assumptions are risky.
Upstream treatment is often cheaper than compensating downstream. Filtration, drying, guard beds, desalting, or tighter feed acceptance limits can protect the units that are most sensitive.
🧫 Catalyst Deactivation
Catalysts make many industrial reactions economically practical, but they do not retain initial activity indefinitely. Activity can decline through poisoning, coking, sintering, mechanical attrition, leaching, or changes in oxidation state.
As activity falls, operators may raise temperature to maintain conversion. This can restore short-term output but may reduce selectivity, accelerate deactivation, increase by-product formation, or push equipment toward metallurgical and safety limits.
A rising reactor temperature requirement at similar feed rate and specification is often a valuable diagnostic signal. It should prompt review of catalyst health, feed contaminants, temperature distribution, and analytical measurements.
🔥 Coke and Polymer Deposits in Reactors
Coke is carbon-rich material that can form from thermal cracking, condensation reactions, or unwanted side reactions. Polymer deposits can similarly develop where reactive monomers contact hot surfaces, stagnant zones, or incompatible contaminants.
Deposits cover catalyst sites, restrict flow paths, and interfere with heat transfer. In fixed-bed reactors, uneven deposition can create maldistribution: some channels carry too much flow while other regions become underused.
Regeneration can sometimes recover activity, but it must follow the catalyst supplier’s and plant’s approved procedures. Excessive regeneration temperatures or poorly controlled oxygen introduction can damage the catalyst or equipment.
🪨 Fouling in Heat Exchangers
Heat exchangers lose effectiveness when deposits create an additional thermal resistance between hot and cold fluids. Common foulants include scale, biological growth, corrosion products, waxes, particulates, and reaction deposits.
The familiar engineering expression for heat duty, Q = U A ΔT, highlights the effect. If fouling lowers the overall heat-transfer coefficient U, the exchanger needs a larger temperature difference to transfer the same duty. If that driving force is unavailable, outlet temperatures drift away from target.
Fouling may also increase pressure drop. Thus, a dirty exchanger can impose both an energy penalty and a pumping or compression penalty.
🌡️ Lost Heat-Transfer Driving Force
Not every exchanger problem is caused by deposits. A change in utility temperature, cooling-water flow, condensing pressure, or process flow arrangement can reduce the available temperature difference.
For example, a condenser may struggle in warm weather because cooling water enters hotter than usual. Operators may increase reflux or reduce throughput to preserve overhead-product quality, but either response can reduce overall efficiency.
Diagnosing this issue requires temperatures, flows, pressures, and—where possible—clean versus current performance calculations. Cleaning an exchanger will not solve a utility-side temperature limitation.
🧊 Cooling-System Degradation
Cooling towers, air coolers, chillers, cooling-water pumps, and distribution systems all influence process performance. Scaling in tower fill, plugged nozzles, fan problems, poor water distribution, or excessive cycles of concentration can limit heat rejection.
Air coolers are sensitive to ambient air temperature, recirculation of hot discharge air, fan condition, and fin cleanliness. A layer of dust or damaged fins reduces effective area and airflow.
Cooling limitations often appear indirectly: higher reactor temperatures, elevated condenser pressure, reduced vacuum quality, or a distillation column that cannot meet separation targets at normal energy use.
⚙️ Pump Wear and Hydraulic Losses
Pumps gradually lose hydraulic performance through impeller wear, internal recirculation, erosion, seal damage, bearing problems, and operation away from their best efficiency point. A pump may still run while delivering less head or flow than expected.
System resistance can also increase. Plugged strainers, partially closed valves, fouled piping, and deposits in equipment raise pressure loss. The pump then operates at a different point on its performance curve, often with greater energy use or unstable flow.
Cavitation deserves attention because collapsing vapor bubbles can damage internals and reduce capacity. Low suction pressure, high liquid temperature, blocked suction lines, or excessive flow can all contribute.
💨 Compressor Inefficiency and Gas Leakage
Compressors are sensitive to suction conditions, gas molecular weight, valve condition, seal leakage, intercooler performance, and internal clearances. Fouled inlet filters raise suction losses, while warmer suction gas reduces density and can limit mass throughput.
Leaks matter not only for emissions and safety but also for energy balance. A compressed-gas leak wastes the work used to compress the gas, and an air leak into a vacuum system can overwhelm downstream equipment.
Performance should be assessed using corrected conditions when possible. Comparing raw power alone across changing ambient temperatures or feed compositions can lead to misleading conclusions.
🧱 Distillation Tray and Packing Problems
Distillation depends on effective vapor-liquid contact. Trays can foul, corrode, lose valves or caps, weep at low vapor flow, or entrain liquid at high vapor flow. Packed columns can suffer from fouling, channeling, damaged distributors, or poor liquid distribution.
The effect is lower separation efficiency per stage or per packed height. Operators may compensate with higher reflux or reboiler duty, which increases energy use and may eventually create flooding or condenser limitations.
A changing pressure profile along the column, abnormal differential pressure, or a persistent inability to meet both overhead and bottoms specifications can suggest an internal hydraulic or contacting problem.
🌀 Maldistribution and Dead Zones
Fluids do not always flow as simplified diagrams imply. In vessels, reactors, storage tanks, and pipelines, poor distribution can create bypassing, stagnation, channeling, or short-circuiting. Material then spends too little or too much time in parts of the system.
In a packed absorber, uneven liquid distribution leaves some packing under-wetted while gas passes preferentially through lower-resistance paths. In a stirred tank, inadequate mixing can leave concentration or temperature gradients near the feed point.
These issues are difficult because average measurements may look acceptable. Internal inspections, tracer studies, temperature mapping, and carefully chosen sampling points can reveal behavior that one outlet analyzer cannot.
🔄 Recycle Build-Up and Purge Imbalance
Recycles improve reactant utilization, but they can also concentrate inerts, by-products, contaminants, or heavy components. If purge flow is too low, unwanted material accumulates. If it is too high, valuable reactants leave the system unnecessarily.
The correct purge rate comes from a material balance, not a fixed habit. Changes in feed impurity level, conversion, or separation performance can alter what the recycle loop can tolerate.
Recycle loops can mask declining single-pass performance because total plant output remains steady until compressor, separator, or reactor capacity is consumed by circulating material that no longer contributes productively.
📏 Instrument Drift and Bad Measurements
A control system can only act on the information it receives. Temperature sensors can drift, pressure transmitters can develop calibration error, flow meters can foul, and composition analyzers can suffer sampling-system or maintenance problems.
One biased measurement may cause a controller to make the wrong correction continuously. For example, a falsely low temperature reading could drive excessive heating, while an analyzer bias could lead to unnecessary reflux, reagent use, or off-spec product.
Calibration is not merely an administrative task. It is part of protecting process efficiency, quality, equipment life, and safe operating margins.
🎛️ Control Loops That No Longer Match the Process
Control tuning that worked after commissioning may become poor as equipment fouls, throughput changes, valves wear, or product campaigns change. A sluggish loop allows disturbances to persist; an overly aggressive loop can create cycling that wastes energy and stresses equipment.
Interactions also matter. A pressure controller, level controller, and temperature controller may each behave acceptably alone while collectively causing oscillation. This is common where utility systems, recycle loops, and distillation controls are tightly coupled.
Periodic control-performance review should consider valve response, sensor quality, process dead time, constraints, and the true control objective—not simply whether the loop remains in automatic mode.
🚪 Valve Stiction and Actuator Problems
Control valves are often the final physical element that implements a control decision. Stiction occurs when static friction causes a valve to resist small movements and then jump suddenly. The resulting sawtooth pattern can create cycling in flow, pressure, temperature, or level.
Positioner problems, air leaks, undersized valves, damaged trim, and incorrect valve characteristics can have similar operational consequences. A controller may be blamed when the actual limitation is mechanical.
Valve travel data, maintenance history, and comparison of commanded versus actual position are useful evidence. Increasing controller gain is usually the wrong first response to a sticking valve.
⚡ Utility Quality and Availability
Steam pressure, steam dryness, cooling-water temperature, refrigeration capacity, instrument air quality, electrical supply, and nitrogen availability all shape process efficiency. Utilities are inputs to the process, not invisible background services.
Wet steam transfers less useful latent heat per unit mass than dry saturated steam and can contribute to water hammer or poor temperature control. Low steam pressure can reduce reboiler duty, while unstable pressure may cause control cycling.
Utility constraints can force production compromises. The operational solution may be load management, repair, insulation improvement, condensate recovery, or a revised production plan rather than a change to the main process unit.
🧯 Steam Leaks, Traps, and Condensate Problems
Steam systems lose efficiency through leaks, failed-open traps, failed-closed traps, uninsulated surfaces, poor condensate return, and flash-steam losses that are not recovered where useful. These losses raise boiler demand and can destabilize heating duties.
A failed-closed trap can flood a heat exchanger with condensate, reducing heat transfer because the heating surface is no longer exposed effectively to condensing steam. A failed-open trap can pass live steam into the condensate system.
Routine trap testing and condensate-system inspection are practical energy measures, but diagnosis should account for process conditions. A trap that appears quiet is not automatically functioning correctly.
🌦️ Ambient Conditions and Seasonal Effects
Plants exchange heat with their surroundings and rely on utilities influenced by weather. Hot weather reduces air-cooler and cooling-tower capacity. Cold conditions may increase heat loss, change liquid viscosity, or create freezing risks. Humidity affects evaporative cooling performance.
Seasonal effects should be anticipated in operating envelopes and performance targets. A summer limitation may be normal for a particular design, while a much larger-than-expected seasonal change may reveal fouling, airflow restrictions, or an underperforming cooling system.
Using normalized data helps separate genuine degradation from predictable environmental variation.
🧊 Insulation Damage and Unintended Heat Loss
Damaged, wet, missing, or poorly installed insulation allows heat to escape from hot equipment and enter cold equipment. Besides increasing energy demand, insulation damage can create personnel burn hazards or surface condensation that accelerates corrosion under insulation.
Heat losses are especially costly on long piping runs, steam headers, hot vessels, and equipment that operates continuously. Small exposed areas can matter when their temperature difference from the surroundings is large.
Thermal imaging can help identify hot spots and cold spots, but findings must be interpreted safely and confirmed against process conditions. Not every warm surface indicates a defect.
🧨 Corrosion, Erosion, and Mechanical Deterioration
Corrosion removes material or creates rough surfaces, while erosion wears surfaces through high-velocity particles or droplets. Both can change pipe diameter, valve behavior, exchanger integrity, pump clearances, and the reliability of containment.
Mechanical deterioration often begins as an efficiency issue before it becomes an integrity issue. Roughness increases frictional pressure drop, leaking seals waste material, and thinning or damaged internals alter hydraulic behavior.
Inspection plans should focus on credible damage mechanisms for the actual chemistry, temperature, pressure, and flow regime. A generic inspection interval cannot replace process-specific understanding.
🧹 Cleaning Practices That Miss the Root Cause
Cleaning restores performance when fouling is the problem, but repeated cleaning without identifying why deposits form turns maintenance into a recurring cost. The cause may be poor filtration, unsuitable water chemistry, temperature excursions, dead legs, incompatible materials, or an upstream separation failure.
Cleaning can also introduce risk. Aggressive chemical cleaning may attack base metal, elastomers, coatings, or catalyst residues if the procedure is not compatible with the equipment and process.
After cleaning, record what was removed, where it formed, and how fast performance had changed. Those observations can guide prevention rather than simply reset the clock.
🧑🏭 Operating Workarounds and Hidden Penalties
Experienced operators often develop workarounds that keep a unit running: opening a bypass, raising a setpoint, increasing purge, adding more steam, or manually adjusting a troublesome loop. These actions can be appropriate in the short term, especially during an upset.
The risk is that a workaround becomes permanent without a formal review. A bypass may reduce residence time, added steam may conceal exchanger fouling, and higher recycle may hide declining conversion while increasing compression duty.
Shift logs should capture the reason for nonstandard operating actions. Management-of-change practices and engineering review help distinguish a safe temporary measure from a new normal with unintended costs.
📊 Establishing a Useful Performance Baseline
You cannot quantify loss without a credible reference. A baseline should represent stable, well-understood operation and include feed properties, throughput, product quality, utility conditions, ambient conditions, key temperatures and pressures, and equipment configuration.
Where conditions vary substantially, use multiple baselines or normalize data. For example, compare compressor power at corrected suction conditions, or compare exchanger performance at similar flow rates and inlet temperatures.
- Choose indicators linked to physical mechanisms, such as pressure drop, approach temperature, or catalyst temperature requirement.
- Track both leading indicators and final outcomes such as energy intensity or off-spec production.
- Document maintenance, feed changes, and operating-mode changes alongside the trends.
A baseline is most valuable when it is easy for operators and engineers to use, not when it is an elaborate report consulted once a year.
🧠 Using Mass and Energy Balances as Diagnostic Tools
Mass and energy balances convert observations into structured questions. If a separator appears to lose recovery, a component balance can test whether material is leaving in another stream, accumulating in inventory, or being measured incorrectly.
An energy balance can reveal unaccounted heat duty, excess utility use, or changing phase behavior. The balance need not be perfect to be useful; even an approximate calculation can narrow the list of plausible causes.
Data quality sets the limit. Before drawing strong conclusions, check meter calibrations, laboratory methods, sampling locations, time alignment, and whether streams are at steady state.
🗂️ A Practical Investigation Sequence
Efficiency investigations work best when they move from symptoms to evidence to mechanisms. Jumping directly to a familiar fix can waste time and sometimes worsen the condition.
- Define the loss clearly: energy, yield, capacity, product quality, reliability, or a combination.
- Compare current operation with a relevant baseline under similar conditions.
- Verify critical measurements and reconcile obvious data conflicts.
- Review changes in feed, utilities, maintenance, control configuration, and operating practices.
- Use balances, trends, and equipment knowledge to rank likely mechanisms.
- Test the safest, least disruptive explanations first, then plan inspection or intervention if needed.
This sequence does not eliminate engineering judgment. It gives that judgment a disciplined framework.
🛠️ Preventive Maintenance Versus Condition-Based Action
Calendar-based maintenance is useful for tasks with predictable wear or mandatory inspection needs. However, cleaning every exchanger or replacing every component on a fixed schedule can waste resources if actual condition is good, or miss rapid deterioration between intervals.
Condition-based approaches use evidence such as vibration, pressure drop, thermal performance, valve signatures, oil analysis, or corrosion monitoring to decide when action is justified. They require reliable data and clear decision thresholds.
The most effective program is often a blend: scheduled checks for essential safeguards and condition monitoring for equipment whose degradation rate varies with service.
🧮 Digital Monitoring Helps, but It Does Not Replace Fundamentals
Historians, dashboards, alarms, and predictive models can reveal patterns that are hard to see in manual logs. They can flag drift early, compare assets, and help engineers focus on the most consequential deviations.
Yet a model is only as good as its inputs and assumptions. A dashboard can confidently display a false trend if a sensor is biased, a tag is misconfigured, or operating modes are mixed without context.
Digital tools are strongest when paired with process knowledge: known constraints, sound balances, field observations, and clear accountability for investigating abnormal trends.
⚠️ Safety and Quality Limits Come Before Optimization
Efficiency improvements must not compromise containment, safe operating limits, environmental controls, or product requirements. Reducing purge, raising temperatures, extending run length, or minimizing maintenance may appear attractive until the associated risks are examined.
Changes should follow the site’s approved procedures, including hazard review where required. This is especially important for reactive chemicals, high-pressure systems, flammable materials, toxic compounds, and equipment with complex interlocks.
The best optimization is one that improves resource use while preserving safety, reliability, and specification compliance. A short-term reduction in energy use is not a true improvement if it creates an unstable or unsafe process.
✅ The Core Principle: Find the Mechanism, Not Just the Symptom
Industrial efficiency declines because real equipment, materials, and operating conditions change. Fouling, catalyst aging, utility limitations, measurement errors, hydraulic problems, and operating workarounds can all produce similar visible symptoms, such as higher energy use or reduced production.
The correct response depends on the mechanism. A rising temperature approach may call for exchanger cleaning, utility improvement, flow correction, or a different diagnosis altogether. A higher reactor temperature may reflect catalyst decline, a feed shift, an instrument error, or heat-transfer limitations.
Strong process engineering combines routine monitoring with physical reasoning. It asks what changed, whether the data are trustworthy, which balance no longer closes, and what equipment behavior should follow if the proposed explanation is correct.
Industrial processes stay efficient when teams treat slow performance drift as measurable evidence, investigate its physical cause, and correct it before temporary compensations become permanent losses. That mindset turns efficiency from a one-time commissioning result into an ongoing engineering discipline. 🧪⚙️📈