
A refinery separates hydrocarbon mixtures into useful fuel fractions. A brewery concentrates alcohol. A pharmaceutical plant recovers a solvent for reuse. Although the products and equipment differ, each operation depends on the same physical question: when a liquid mixture and its vapor meet, what will each phase contain?
That question is answered by vapor-liquid equilibrium, usually shortened to VLE. It explains why boiling does not simply turn a liquid mixture into vapor with the same composition, and why a distillation column can enrich one component while rejecting another.
VLE may first appear as a set of curves, equations, and thermodynamic models. In practice, it is the map behind column pressure, temperature, reflux, condenser duty, reboiler duty, product purity, and even whether a proposed separation is realistic.
For students, VLE connects thermodynamics to equipment design. For working engineers, it is an operating reality: a column follows equilibrium only imperfectly, but every useful adjustment is judged against what equilibrium allows.
🌡️ What Vapor-Liquid Equilibrium Means
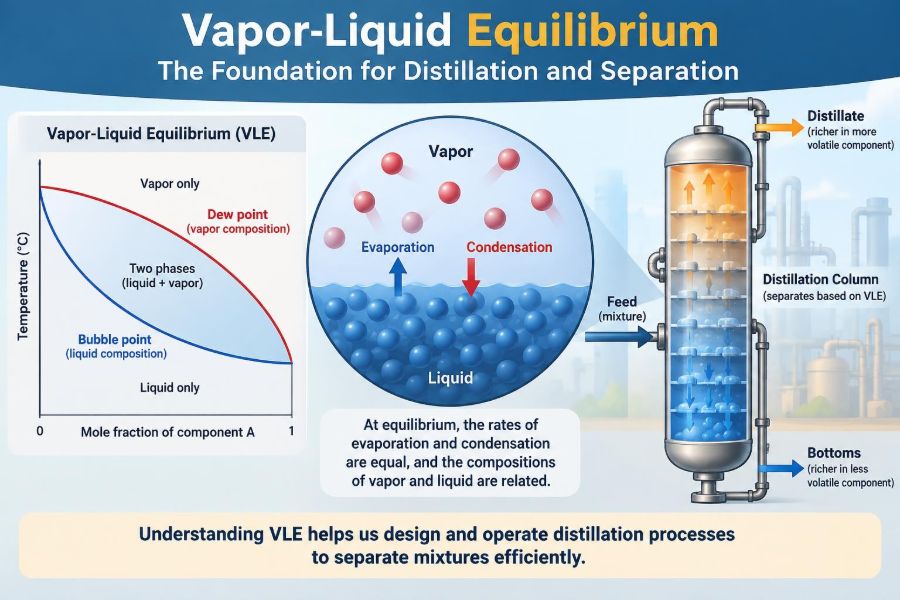
Vapor-liquid equilibrium exists when liquid and vapor phases are in contact at a fixed temperature and pressure, with no net change in their compositions over time. Molecules still evaporate from the liquid and condense from the vapor continuously; the rates simply balance for each component.
Consider a closed vessel containing liquid ethanol and water with a vapor space above it. Ethanol molecules tend to escape the liquid more readily than water molecules. At equilibrium, the vapor is therefore richer in ethanol than the liquid, even though both phases contain both components.
Equilibrium is a thermodynamic reference state, not a claim that all industrial equipment is motionless or perfectly settled.
⚖️ Equilibrium Is Not Equal Composition
A frequent early mistake is to assume that vapor formed from a liquid mixture has the same composition as the liquid. That can be true only in special cases, such as an azeotrope at its azeotropic composition.
For a binary mixture, let xi represent the liquid mole fraction of component i, and yi represent its vapor mole fraction. If component A is more volatile than B, then at equilibrium it commonly has yA greater than xA.
That composition difference is the basic driving opportunity for ordinary distillation. Without it, repeated vaporization and condensation could not improve purity.
🫧 Why Some Molecules Prefer the Vapor
At a given temperature, molecules in a liquid have a distribution of energies. Some at the surface have enough energy to overcome intermolecular attractions and enter the vapor phase. Liquids with weaker effective molecular attractions, all else equal, usually exert a higher vapor pressure.
A component described as more volatile has a stronger tendency to enter the vapor phase at the conditions of interest. “More volatile” is more useful than “lower boiling point” because volatility is always conditional on mixture composition, temperature, and pressure.
Interactions matter. Hydrogen bonding, polarity, molecular size, and molecular shape can all change how willingly molecules leave a mixture.
🔍 Vapor Pressure Is the Starting Point
For a pure liquid, vapor pressure is the pressure exerted by its equilibrium vapor at a specified temperature. As temperature rises, more molecules can escape the liquid, so vapor pressure rises.
A pure component boils when its vapor pressure equals the external pressure. At lower pressure it reaches that condition at a lower temperature; at higher pressure it requires a higher temperature. This is why vacuum distillation can process heat-sensitive materials at reduced temperatures.
In mixtures, each component contributes to the total pressure according to its tendency to escape and its concentration in the liquid. VLE builds on this pure-component behavior.
🧪 Raoult’s Law for Ideal Liquid Mixtures
For an ideal liquid mixture, Raoult’s law relates a component’s partial pressure to its liquid composition:
pᵢ = xᵢ Pᵢsat
Here, pi is partial pressure, xi is liquid mole fraction, and Pisat is the pure-component saturation vapor pressure at the same temperature. The total pressure is the sum of the partial pressures.
Raoult’s law is most useful when unlike molecular interactions resemble like molecular interactions. It is a valuable teaching model, but engineers should not assume it accurately represents every real mixture.
💨 Dalton’s Law Connects Partial and Total Pressure
Dalton’s law states that total vapor pressure is the sum of component partial pressures:
P = Σpᵢ
The vapor-phase mole fraction then follows from yi = pi/P. Combined with Raoult’s law, this produces a simple ideal-mixture VLE relationship.
For a binary mixture, the component with the larger saturation vapor pressure usually occupies a larger fraction of the vapor. This is the molecular basis for vapor enrichment.
🧩 Activity Coefficients Describe Liquid Nonideality
Many industrial mixtures are not ideal. The presence of one component can alter the escaping tendency of another because unlike molecular interactions are significantly stronger or weaker than interactions in the pure liquids.
An activity-coefficient form of the equilibrium relation is often written as:
pᵢ = xᵢ γᵢ Pᵢsat
The activity coefficient, γi, accounts for liquid-phase nonideality. A value near one suggests behavior close to ideality under the model’s conditions; deviations reflect altered escaping tendencies. It is not a universal material constant.
🧯 Fugacity Matters at Higher Pressure
At modest pressures, treating vapor as an ideal gas is often a useful approximation. At elevated pressures, especially with hydrocarbons, dense gases, or near-critical conditions, vapor-phase nonideality can become significant.
Engineers then use fugacity, an effective thermodynamic pressure that represents a component’s escaping tendency more rigorously. At equilibrium, the fugacity of each component must be equal in both phases.
This principle is broader than any one VLE equation. It is why equation-of-state methods are widely used for high-pressure gas processing and petroleum systems.
📏 The K-Value Gives a Fast VLE Measure
A practical equilibrium ratio is the K-value:
Kᵢ = yᵢ / xᵢ
If Ki is greater than one, component i is relatively enriched in the vapor. If it is less than one, it is relatively concentrated in the liquid. K-values vary with temperature, pressure, and mixture composition.
Flash calculations, shortcut separation methods, and process simulators commonly use K-values. They offer a compact way to express the phase split without losing the central composition relationship.
📊 Reading a T-x-y Diagram
A temperature-composition diagram at constant pressure, often called a T-x-y diagram, shows the equilibrium temperatures and compositions of a binary system. The lower boundary is usually the bubble-point curve; the upper boundary is the dew-point curve.
Below the bubble curve, the material is entirely liquid. Above the dew curve, it is entirely vapor. Between the curves, liquid and vapor coexist.
A horizontal line through the two-phase region identifies compositions of the equilibrium liquid and vapor at that temperature. The vapor endpoint is enriched in the more volatile component.
📉 Reading a P-x-y Diagram
A pressure-composition diagram presents the same equilibrium idea at fixed temperature. The bubble-point boundary identifies pressures at which a liquid first forms vapor as pressure is reduced. The dew-point boundary identifies pressures at which vapor first forms liquid as pressure is increased.
This format is particularly intuitive for operations where pressure is the manipulated variable, such as flash drums, condensers, and pressurized fractionation systems.
Whether temperature or pressure is plotted, the two-phase region is not a vague transition zone. It is a region where phase amounts and phase compositions must be determined together.
🫧 Bubble Point: The First Vapor Bubble
The bubble point is the condition at which a liquid mixture begins to boil: an infinitesimal amount of vapor is in equilibrium with the liquid. The liquid composition is known, while the first vapor bubble has a different composition.
Bubble-point calculations are useful for estimating reboiler behavior and locating phase boundaries. Heating a subcooled liquid to its bubble point does not mean the entire stream instantly becomes vapor; it marks the beginning of vapor formation.
For multicomponent mixtures, bubble-point temperature or pressure is found by satisfying equilibrium relations for all components simultaneously.
💧 Dew Point: The First Liquid Drop
The dew point is the corresponding condition at which a vapor mixture first begins to condense. The first liquid droplet generally has a composition different from the vapor feed.
Dew-point information is essential in partial condensers, gas dehydration, refrigeration, and pipelines where unexpected condensation can affect flow, corrosion, separation, or measurement.
Bubble point and dew point should never be treated as interchangeable. One starts from a liquid composition; the other starts from a vapor composition.
🧮 The Lever Rule Determines Phase Amounts
Once a system lies inside a two-phase region, equilibrium diagrams provide phase compositions but not automatically the amounts of liquid and vapor. The lever rule supplies the relative phase quantities for a binary mixture.
On a diagram’s tie line, the fraction of one phase is proportional to the distance from the overall composition to the opposite phase endpoint. A material balance gives the same answer.
This distinction matters in a flash drum. A stream may be clearly in a vapor-liquid region, yet the process design still needs vapor rate and liquid rate to size equipment and calculate downstream loads.
⚡ Flash Separation Uses One Equilibrium Contact
A flash drum is one of the simplest VLE applications. A feed is heated, depressurized, or both, and then allowed to separate into an equilibrium vapor and liquid. The vapor is richer in more volatile components; the liquid is richer in less volatile ones.
Flash separation is less sharp than multistage distillation, but it has advantages: fewer internals, lower complexity, and usefulness as a first separation step.
A typical calculation combines total and component material balances with equilibrium relations. The result predicts vapor fraction and the compositions of both outlet streams.
🏭 Why a Single Stage Rarely Delivers High Purity
One equilibrium contact creates enrichment, not usually a finished product. If a feed contains several components with moderately similar volatilities, the composition shift from one flash or one simple distillation step may be limited.
Distillation columns solve this by repeating equilibrium contact many times. Rising vapor meets descending liquid across trays or packing, creating successive opportunities for mass transfer and composition change.
Each stage builds on the enrichment created by the previous one. The top tends toward volatile-rich material, while the bottom tends toward heavy-component-rich material.
🪜 The Theoretical Stage Is an Ideal Benchmark
A theoretical stage is an idealized contact where exiting vapor and liquid are at equilibrium. It is a calculation tool, not necessarily one physical tray.
Real trays may not achieve complete mixing, adequate contact time, or ideal vapor-liquid distribution. Packed columns do not have discrete trays at all, so their performance is commonly expressed as an equivalent height per theoretical stage.
Separating “equilibrium stages” from “actual hardware” prevents a common design error: assuming a diagram-based stage count can be installed directly without accounting for efficiency.
🔄 Reflux Makes Rectification Possible
At the top of a distillation column, condensed overhead liquid is often divided into product and reflux, which returns to the column. Reflux provides liquid flowing downward to contact rising vapor.
Increasing reflux generally improves separation because it supplies more internal liquid for repeated equilibration. However, it also increases internal flows and commonly raises condenser and reboiler duties.
The practical goal is not maximum reflux. It is an operating point that meets purity and recovery needs with acceptable energy use, hydraulic limits, and controllability.
🔥 The Reboiler and Condenser Create the Internal Traffic
The reboiler adds heat near the column bottom and generates vapor that rises through the column. The condenser removes heat from overhead vapor, creating reflux and usually a liquid distillate product.
These devices do more than heat and cool streams. They establish the internal vapor and liquid traffic that lets stages approach their equilibrium targets.
Changing reboiler duty can shift bottom composition and vapor flow. Changing reflux can affect top purity, column temperature profile, and internal liquid loading. Their effects are coupled, so plant control strategies must account for interactions.
📐 Relative Volatility Measures Separation Difficulty
For two components A and B, relative volatility is often represented by:
αAB = (yA/xA) / (yB/xB) = KA/KB
When A is more volatile than B, αAB is greater than one. A larger value generally means VLE provides a stronger composition difference and ordinary distillation is easier.
When relative volatility approaches one, the vapor and liquid compositions become similar. More stages, more reflux, and more energy may be needed, and another separation method may ultimately be preferable.
🚧 Azeotropes Set a Thermodynamic Limit
An azeotrope is a mixture composition at which vapor and liquid have the same composition at equilibrium. At that point, ordinary distillation cannot enrich either phase beyond the azeotropic composition under those pressure conditions.
Ethanol-water is a familiar teaching example of azeotropic behavior. Its details depend on pressure, but the broad lesson is universal: a favorable boiling-point difference alone does not guarantee unlimited separation.
Possible alternatives include pressure-swing distillation, extractive distillation, azeotropic distillation, membranes, adsorption, or hybrid processes. The appropriate choice depends on solvent compatibility, economics, purity target, and safety constraints.
🧷 Positive and Negative Deviations Change the Curves
When unlike molecules attract each other less strongly than expected from ideal behavior, components may escape more readily, producing a positive deviation from Raoult’s law. A minimum-boiling azeotrope can result in some systems.
When unlike attractions are unusually strong, escaping can be suppressed, producing a negative deviation. Some mixtures then form maximum-boiling azeotropes.
These labels describe thermodynamic behavior, not quality or desirability. Their design significance is that they can bend VLE curves in ways ideal-mixture assumptions cannot predict.
🧠 Choosing a Thermodynamic Model Carefully
Model selection depends on the chemicals and conditions. Activity-coefficient models are often suited to low- or moderate-pressure liquid mixtures with significant nonideality. Cubic equations of state are frequently applied to hydrocarbon-rich and higher-pressure systems.
Common model families include NRTL, UNIQUAC, and Wilson for liquid-phase activity behavior, along with equation-of-state approaches such as Peng-Robinson or Soave-Redlich-Kwong for many vapor and hydrocarbon systems.
No model name guarantees accuracy. Parameters, applicable composition range, temperature range, and the quality of available data all matter.
🗂️ Experimental Data Still Anchor Good Predictions
Thermodynamic models are calibrated and checked against measurements such as VLE data, heats of mixing, densities, and related phase-equilibrium information. When data are sparse, model predictions become more uncertain, especially for strongly associating or complex mixtures.
A good engineering workflow compares predictions with credible process observations where possible: condenser temperatures, product analyses, pressure profiles, and known phase behavior. A simulator can converge mathematically while representing the wrong physical system.
For safety-critical or high-value separations, uncertainty should be treated explicitly through validation, sensitivity analysis, and appropriate review rather than hidden behind a single calculated answer.
📦 Feed Condition Changes Column Behavior
A feed entering a distillation column may be subcooled liquid, saturated liquid, partially vaporized, saturated vapor, or superheated vapor. Its condition changes how much internal vapor and liquid traffic is required around the feed tray.
A colder liquid feed may require more vapor condensation locally, while a vapor-rich feed can contribute vapor flow. In shortcut methods, this effect is represented by a feed-quality parameter.
Feed condition does not change equilibrium itself, but it changes the material and energy balance through the column, which changes operating lines and utility demand.
🧱 Trays and Packing Create Real Mass Transfer
Tray columns bring vapor and liquid into contact on discrete plates. Packed columns spread liquid over structured or random surfaces while vapor flows through void spaces. Both aim to create interfacial area and sufficient contact for mass transfer.
Choice depends on factors such as pressure drop, fouling tendency, liquid distribution, turndown, diameter, maintenance practices, and vacuum operation. Packing often offers lower pressure drop, while trays can be robust and easier to inspect in some services.
Neither is automatically superior. VLE defines the target composition relationship; hardware determines how closely and efficiently the process approaches it.
🚨 Hydraulics Can Prevent Equilibrium Performance
A column may have sound equilibrium calculations and still fail to meet specification because of hydraulic limits. Flooding occurs when vapor flow interferes with downward liquid flow, sharply increasing pressure drop and reducing effective contacting.
Other problems include weeping through tray perforations at low vapor rates, entrainment of liquid droplets upward, poor liquid distribution in packing, foaming, and fouling. These phenomena reduce separation efficiency or destabilize operation.
When product purity suddenly worsens, checking temperatures alone is not enough. Pressure drop, differential pressure trends, flow rates, and physical condition often reveal the actual constraint.
🎛️ Temperature Is Useful but Not a Direct Composition Reading
Column temperatures are widely monitored because, at a given pressure and composition range, they respond meaningfully to composition changes. A temperature profile can therefore provide a fast operational signal.
But temperature is not a universal purity measurement. Pressure changes, multicomponent effects, azeotropes, sensor location, and changing feed composition can all shift the relationship between temperature and product quality.
Reliable control commonly combines temperature measurements with pressure control, flow measurements, periodic laboratory analysis, and online analyzers where justified.
🔧 Pressure Is a Powerful Design and Operating Variable
Changing pressure changes boiling temperatures and often changes relative volatility. Lower pressure can protect temperature-sensitive compounds and reduce bottom temperatures, but it may increase vapor volume and equipment size.
Higher pressure can make condensation possible with available cooling utilities, but may worsen a difficult split or impose material and energy penalties. Pressure changes can also shift azeotropic behavior enough to support pressure-swing distillation in suitable systems.
The best pressure is therefore a system decision involving phase equilibrium, heat integration, utilities, mechanical design, and control—not just the lowest achievable temperature.
🧼 Impurities and Trace Components Can Matter Greatly
Trace water, dissolved gases, salts, degradation products, or unexpected solvents can alter VLE, create additional phases, promote foaming, or change corrosion behavior. Their concentration may be small while their operational effect is not.
For example, a nonvolatile contaminant will usually remain in the liquid and can accumulate in a bottoms system. A light impurity may concentrate overhead and affect condenser performance or vent handling.
Material balances should track consequential minor components rather than treating every feed as a clean binary mixture.
🧮 From Binary Diagrams to Multicomponent Columns
Binary diagrams are essential learning tools because they make the vapor-liquid composition difference visible. Industrial columns, however, often handle many components, side draws, recycle streams, and feeds whose composition varies over time.
Multicomponent design uses component material balances, energy balances, phase-equilibrium relations, and hydraulic constraints together. Numerical methods and simulation are valuable because manually drawing equilibrium stages is no longer practical.
The underlying logic remains unchanged: every stage seeks a vapor-liquid split consistent with thermodynamics, while flows and heat determine how much material reaches that stage.
🛑 Common VLE Mistakes to Avoid
- Using normal boiling points as the entire design basis: mixture behavior and operating pressure can change the separation picture.
- Assuming ideality without checking chemistry: polar or associating systems can deviate strongly from Raoult’s law.
- Calling every tray an equilibrium stage: real efficiency and hydraulics must be considered.
- Ignoring pressure variation: equilibrium data at one pressure may not apply elsewhere in the column.
- Trusting simulation defaults blindly: thermodynamic package selection and input data require engineering judgment.
These mistakes are connected: each replaces a conditional physical relationship with an overly simple rule.
🧭 A Practical Workflow for VLE Problems
- Define components, feed composition, flow rate, temperature, pressure, and impurity information.
- Identify likely phases and obtain relevant pure-component and mixture-property data.
- Select a thermodynamic model suited to the chemistry and pressure range.
- Check bubble point, dew point, K-values, and any known azeotropic or liquid-liquid behavior.
- Perform material and energy balances before interpreting column performance.
- Validate predictions against measured plant or laboratory information when available.
- Test sensitivity to feed variation, pressure, model parameters, and operating targets.
This sequence does not eliminate uncertainty, but it makes assumptions visible early enough to correct them.
💡 The Core Principle Behind Every Separation
VLE matters because distillation exploits a difference in how components distribute themselves between vapor and liquid. The vapor becomes relatively richer in components with greater escaping tendency; repeated contact turns that tendency into a useful separation.
Everything else—reflux, stages, tray efficiency, pressure selection, thermodynamic models, and energy integration—exists to manage or predict that distribution in a real process.
A distillation column cannot create a separation forbidden by equilibrium, but good engineering can use favorable equilibrium efficiently and recognize when another method is needed.
Once VLE is viewed as the connection between molecular interactions and plant-scale decisions, phase diagrams and column calculations become less like isolated formulas and more like a practical language for separation. 🧪🌡️⚙️