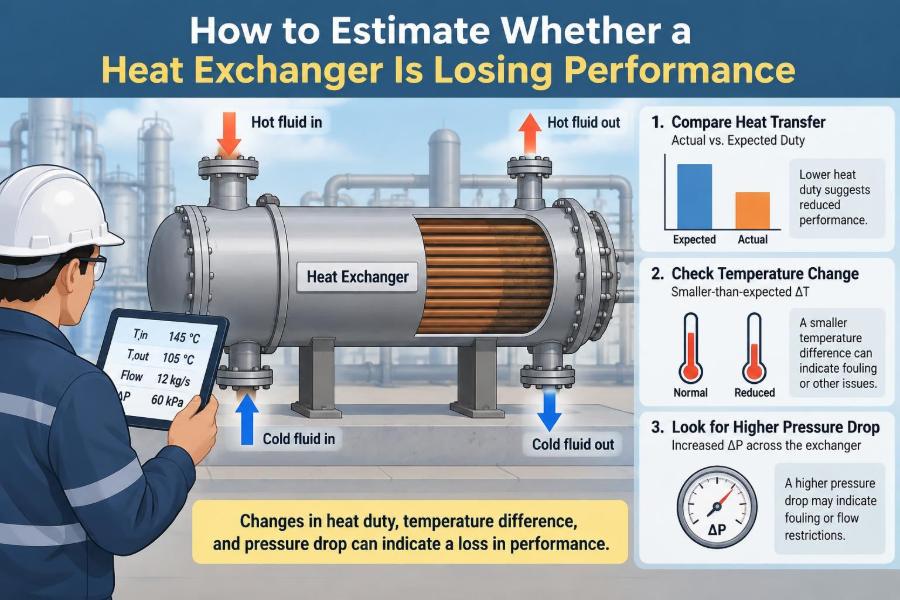

A heat exchanger can appear to be operating normally while quietly consuming more utility, limiting production, or pushing a downstream process away from its target temperature. The pump is running, the control valve is moving, and neither stream has stopped—yet the equipment may no longer be transferring heat as intended.
This situation is familiar in plants, buildings, food operations, refineries, and laboratory-scale systems. A cooler may stop reaching its outlet-temperature target. A reboiler may demand more steam. A chiller may run longer to do the same job. The underlying issue is often called heat-exchanger performance degradation.
Finding it early is valuable because fouling, flow restrictions, bypassing, and instrumentation problems can look similar at first. A sound estimate starts with operating data, not with an immediate assumption that the exchanger needs cleaning.
The aim is not to produce one impressive-looking number. It is to compare heat duty, temperature driving force, flow behavior, and pressure drop in a way that reveals whether the exchanger itself is changing—and why.
🔍 Start With the Meaning of “Losing Performance”
A heat exchanger loses performance when it transfers less heat than required under comparable operating conditions, or when it needs a larger temperature difference, more flow, or more utility to deliver the same duty.
This distinction matters. A lower process heat load is not necessarily poor exchanger performance. If a feed stream enters warmer than usual, for example, the exchanger may remove less heat simply because there is less heat to remove.
Performance must therefore be judged against a comparable operating baseline, not against a single historical outlet temperature.
🌡️ Understand the Basic Heat-Duty Balance
The heat duty, Q, is the rate of heat transferred. For a single-phase stream with no phase change, estimate it from:
Q = ṁ Cp (Tout − Tin)
Here, ṁ is mass flow rate, Cp is specific heat capacity, and Tin and Tout are inlet and outlet temperatures. Use the sign convention consistently; in practice, engineers often compare the magnitude of heat lost by the hot stream with heat gained by the cold stream.
For condensing steam, boiling fluids, or refrigerants, latent heat can dominate. In those cases, a simple CpΔT calculation is incomplete, and enthalpy data are needed.
⚖️ Check Both Sides of the Energy Balance
When measurements are reliable and heat loss to the surroundings is modest, duty calculated on the hot side should be close to duty calculated on the cold side. A large mismatch is a diagnostic clue, not an inconvenience to ignore.
- A wrong flow measurement can distort one side.
- A temperature sensor may be biased or installed in a poorly mixed location.
- Specific heat may be estimated poorly for a changing composition.
- Unaccounted phase change or a side stream may be present.
Do not calculate an overall heat-transfer coefficient from questionable duty data. First decide which measurements are credible enough for the operating decision.
🧭 Establish a Meaningful Baseline
The best baseline is commissioning data or results from a verified clean condition at known flow rates and inlet temperatures. If that is unavailable, select a period when the exchanger was known to meet its duty with normal utility use and stable pressure drops.
Record more than temperatures. A practical baseline includes flow rates, inlet pressures, outlet pressures, fluid properties or composition, control-valve position, utility conditions, and production rate.
A “normal” outlet temperature by itself is weak evidence. A controller can preserve that temperature by opening a steam valve farther, increasing cooling-water flow, or accepting a higher energy cost.
🧼 Recognize Fouling as Thermal Resistance
Fouling is the accumulation of material on heat-transfer surfaces. Scale, corrosion products, biological growth, coke, polymer deposits, fibers, and suspended solids are common examples.
Deposits add thermal resistance between the two fluids. In simple terms, heat must pass through an extra insulating layer before reaching the other stream. The result is often a falling overall heat-transfer coefficient, commonly written as U.
Fouling is not always uniform. A small heavily fouled region can alter flow distribution and create a larger effect than its area alone suggests.
📐 Use the Overall Heat-Transfer Relationship
A widely used performance expression is:
Q = U A ΔTlm
A is heat-transfer area, and ΔTlm is the log-mean temperature difference, or LMTD. If geometry is unchanged, a declining value of UA at comparable conditions is strong evidence that thermal performance has deteriorated.
Field calculations often focus on UA rather than U, because the effective area can be uncertain in multi-pass equipment, partially isolated bundles, or exchangers with unknown active plate count.
📏 Calculate LMTD Carefully
For a true countercurrent exchanger, define the two end temperature differences:
ΔT1 = Th,in − Tc,out
ΔT2 = Th,out − Tc,in
ΔTlm = (ΔT1 − ΔT2) / ln(ΔT1 / ΔT2)
For cocurrent flow, pair inlet with inlet and outlet with outlet instead. Shell-and-tube exchangers with multiple passes often require a correction factor, F, so the usable driving force becomes FΔTlm.
If either terminal temperature difference is zero or changes sign, do not force the calculation. The data may indicate a temperature crossover, a wrong tag, a sensor error, or a configuration that requires a different model.
🔄 Account for Exchanger Flow Arrangement
Countercurrent flow generally uses the available temperature driving force more effectively than cocurrent flow. Crossflow, multiple shell passes, and plate patterns fall between simplified textbook cases and require appropriate correction methods.
This is why an LMTD calculation without knowing the flow arrangement can be misleading. The same four temperatures can produce an apparently reasonable result while the selected model is physically inappropriate.
For quick trending, use the same calculation method consistently. For troubleshooting or design decisions, confirm the actual configuration from drawings or manufacturer documentation.
📉 Watch the Temperature Approach
The temperature approach is the difference between streams at one end of the exchanger. In a cooler, a common approach is the hot-fluid outlet temperature minus cooling-water inlet temperature.
If cooling-water inlet temperature and process conditions remain similar, a growing hot-end approach often indicates reduced heat transfer. It can also result from lower cooling-water flow, warmer utility water, or a changed process duty.
Approach temperature is fast to trend and easy to explain, but it is a screening indicator rather than a complete performance test.
📊 Trend Duty Instead of Chasing One Reading
Single operating snapshots are vulnerable to noise. A more useful method is to trend calculated duty, outlet temperatures, pressure drop, utility flow, and valve position over days or batches.
Look for a persistent shift under comparable loads. A gradual decline in UA over several weeks suggests fouling or loss of active area. A sudden change points more strongly toward a valve, pump, bypass, blockage, operating change, or instrument issue.
Normalize trends where possible. Compare similar feed rates, inlet temperatures, and compositions rather than averaging all production conditions together.
💧 Treat Cooling-Water Temperature as a Major Variable
Cooling water is often assumed to be constant, but its supply temperature can vary with season, cooling-tower performance, wet-bulb conditions, tower load, or recirculation problems.
When cooling water enters warmer, the driving force falls even if the exchanger is perfectly clean. The process outlet temperature may rise, and operators may understandably suspect fouling.
Always trend cooling-water inlet and outlet temperatures together with process temperatures. Comparing only the process outlet can mistake a utility limitation for exchanger degradation.
🚰 Separate Low Flow From Poor Heat Transfer
Heat-transfer coefficients commonly depend on fluid velocity. Lower flow can reduce turbulence and lower the film coefficient, especially on the side with the controlling resistance.
Low flow may come from a throttled valve, worn pump, blocked strainer, plugged tubes, air binding, an incorrectly positioned bypass, or a change in parallel-equipment lineup. These are not identical problems, even though all can reduce duty.
Confirm actual flow when possible. Valve position is not flow measurement: a valve can be fully open while a restriction upstream limits delivery.
🧱 Use Pressure Drop as a Second Diagnostic Signal
Pressure drop, ΔP, provides a second view of exchanger health. Deposits and plugging often reduce flow area, so pressure drop rises at the same flow rate.
The pattern is informative. Falling UA with rising pressure drop is consistent with many fouling scenarios. Falling UA with falling pressure drop may indicate bypassing, reduced flow, tube leakage, or a measurement issue rather than simple deposition.
Pressure drop must be compared at similar flow rates. Since friction losses rise strongly with velocity, a higher ΔP at higher flow is not automatically abnormal.
🕳️ Consider Bypass and Maldistribution
Not every performance loss comes from dirty surface. Fluid may bypass the intended heat-transfer path through a leaking internal partition, damaged gasket, open bypass line, incorrect valve lineup, or shell-side baffle problem.
In plate-and-frame exchangers, failed gaskets, blocked channels, or uneven tightening can affect distribution. In shell-and-tube units, pass-partition leakage and bundle bypassing can reduce effective temperature driving force.
These faults may produce poor thermal performance without the large pressure-drop increase expected from widespread fouling.
🧪 Check Whether Fluid Properties Have Changed
Viscosity, density, heat capacity, thermal conductivity, and fouling tendency can change with composition and temperature. A product becoming more viscous can reduce turbulence and heat transfer while increasing pressure drop.
Using water properties for a glycol mixture, hydrocarbon blend, slurry, or concentrated process stream can create an attractive but inaccurate duty calculation. Use process data, laboratory results, or a justified property model when available.
Property changes are especially relevant during grade changes, seasonal formulation shifts, concentration campaigns, and startup or shutdown transitions.
🔥 Distinguish Sensible Heat From Phase Change
Sensible heating changes a fluid’s temperature. Phase change transfers latent heat at nearly constant temperature, as in steam condensation or refrigerant evaporation.
A steam heater may show little steam-side temperature change while transferring substantial duty. Estimate its duty from condensate rate and steam enthalpy change, not from a steam-side CpΔT calculation.
Similarly, a condenser can lose performance because noncondensable gases accumulate. The issue is not merely “dirty tubes”; gases can blanket the surface and reduce the effective vapor-side heat transfer.
🧰 Verify Instruments Before Blaming Equipment
Temperature error is often the largest source of uncertainty in field heat-exchanger calculations because LMTD depends on differences between measured temperatures. Small bias becomes especially damaging when terminal approaches are small.
Check that sensors are in the correct locations, immersed in well-mixed fluid, calibrated appropriately, and reporting the correct engineering units. Compare redundant indicators where available.
- Confirm flowmeter range, density compensation, and zero stability.
- Check pressure transmitters against local gauges or test points.
- Verify tag mapping in historian calculations.
- Review whether sensors were replaced, rescaled, or reconfigured.
An apparent overnight fouling event immediately after maintenance is often worth investigating as an instrumentation or lineup change first.
🧮 Estimate UA From Plant Data
Once duty and corrected driving force are reasonably reliable, calculate:
UA = Q / (F ΔTlm)
Use consistent units, such as W/K or kW/K. Then compare the result with a clean baseline calculated in the same way. A lower UA means the exchanger transfers less heat per degree of available driving force.
This estimate does not identify the exact resistance causing the loss. It is a performance indicator that directs the next inspection, test, or operating intervention.
📈 Interpret a Simple Hypothetical Example
Imagine a process cooler that historically removes about the same duty at a given production rate. Its cooling-water inlet temperature and flow are unchanged, but the process outlet temperature gradually rises and calculated UA falls over several operating periods.
If cooling-water-side pressure drop also rises at comparable flow, tube-side or channel fouling becomes plausible. If pressure drop falls while duty falls, first investigate declining water flow, a bypass, or a measurement problem.
The example is deliberately simplified. Real decisions should include composition, pump behavior, exchanger arrangement, and uncertainty in the measurements.
🧷 Use Effectiveness When a Clean UA Is Unknown
Heat-exchanger effectiveness compares actual heat transfer with the maximum theoretically possible transfer for the entering stream conditions:
ε = Qactual / Qmaximum
For a simple two-stream exchanger, Qmaximum is based on the smaller heat-capacity rate, Cmin, multiplied by the difference between hot and cold inlet temperatures.
Effectiveness is useful when comparing similar operating cases, particularly where flow rates vary. It still depends on trustworthy flow and temperature data, and phase-change systems require careful treatment.
🗂️ Build a Practical Monitoring Sheet
A useful monitoring sheet need not be elaborate. It should make changes visible before they become operational emergencies.
| Parameter | Why it is tracked | Useful comparison |
|---|---|---|
| Process inlet/outlet temperatures | Shows achieved process cooling or heating | Similar feed rate and composition |
| Utility inlet/outlet temperatures | Defines available driving force | Similar ambient and utility conditions |
| Flow rates | Supports duty and velocity assessment | Same production state |
| Pressure drop | Signals restriction or flow-path changes | Similar flow rate |
| UA or effectiveness | Combines thermal observations | Validated clean baseline |
| Valve position and pump status | Reveals control effort and lineup changes | Normal operating strategy |
Trend limits should be site-specific. A limit that ignores measurement uncertainty and normal operating variation creates nuisance alarms rather than useful action.
🧹 Decide When Cleaning Is Justified
Cleaning is justified when analysis shows a meaningful, persistent performance penalty and the expected benefit exceeds the shutdown, labor, chemical, and equipment risks. It is not automatically the right response to every warm outlet stream.
Mechanical cleaning can remove many deposits but may be unsuitable for delicate tubes or complex plate channels. Chemical cleaning can be effective, but chemical selection must match deposit chemistry and equipment metallurgy.
Before cleaning, document performance. After cleaning, repeat the same calculations. The before-and-after comparison helps confirm whether fouling was truly the controlling problem.
⚠️ Respect Cleaning and Inspection Risks
Opening equipment introduces hazards: residual pressure, hot liquid, corrosive deposits, confined-space concerns, lifting risks, and chemical exposure. Isolation, draining, venting, and verification must follow the site’s established procedures.
Chemical cleaning can attack base metal, gaskets, and protective films if concentration, temperature, contact time, or inhibitor selection is wrong. Cleaning waste may also require controlled handling.
Inspection findings should be recorded by location. Deposit appearance—hard scale, soft sludge, oily film, biological material, or corrosion debris—can guide prevention more effectively than a generic “fouled” label.
🛠️ Address the Root Cause, Not Only the Deposit
A cleaned exchanger will foul again if the underlying driver remains. Root causes may include poor filtration, unstable water chemistry, excessive temperature at the wall, contamination ingress, low-flow operation, corrosion, or incompatible materials.
Possible corrective actions include improving strainers or filtration, controlling cooling-water treatment, adjusting velocities, reducing hot spots, correcting dead legs, and revising cleaning intervals based on actual trend data.
Some services inherently foul. The practical objective may be predictable, manageable degradation rather than an unrealistic expectation of zero fouling.
🧩 Consider Parallel and Series Equipment Effects
Plants often have exchangers arranged in parallel or series. In parallel service, one fouled exchanger can force more flow through the cleaner unit, making total system behavior difficult to interpret from a single shared outlet temperature.
In series, the upstream exchanger changes the inlet condition of the downstream exchanger. A problem in one unit can appear as poor performance in another.
Where possible, collect individual branch flows, pressure drops, and temperatures. System-level data are useful, but they can hide an underperforming branch.
🚫 Avoid Common Diagnostic Shortcuts
Several shortcuts lead to unnecessary cleaning or missed faults:
- Judging health from process outlet temperature alone.
- Comparing pressure drop without correcting for flow rate.
- Assuming a wide-open control valve proves the exchanger is fouled.
- Using nominal design flow instead of measured flow.
- Ignoring utility inlet conditions and ambient effects.
- Calculating LMTD with a temperature crossover and accepting the result.
- Calling every UA change “fouling” before checking instruments.
A disciplined diagnosis considers competing explanations and looks for a pattern across several measurements.
🧠 Know the Limits of a Field Estimate
Plant calculations are estimates, not laboratory measurements. Heat losses, sensor accuracy, unmeasured bypasses, uncertain properties, changing phase behavior, and incomplete geometry all introduce uncertainty.
That uncertainty does not make monitoring useless. It means decisions should reflect the size and persistence of the observed change. A small UA shift within normal measurement scatter deserves observation; a sustained shift coupled with process constraints deserves investigation.
For high-consequence equipment, a detailed thermal rating, inspection, nondestructive testing, or specialist review may be appropriate.
✅ Turn the Estimate Into an Operating Decision
A practical decision sequence is straightforward:
- Confirm the process requirement and compare like-for-like operating periods.
- Validate temperatures, flows, pressures, and unit conversions.
- Calculate duty on both sides where possible.
- Evaluate LMTD, corrected UA, effectiveness, and pressure-drop trends.
- Check utility supply, flow restrictions, bypasses, and control behavior.
- Choose observation, operational adjustment, inspection, cleaning, or engineering review based on evidence.
This sequence prevents a costly intervention from becoming the first diagnostic tool.
🎯 The Core Principle: Compare Heat Transfer Under Comparable Conditions
The most reliable sign of declining exchanger performance is not one temperature, one valve position, or one pressure reading. It is a consistent reduction in heat transfer capability after accounting for inlet conditions, flow rates, fluid properties, exchanger configuration, and measurement quality.
Use duty to show what is being transferred, LMTD or effectiveness to show the available thermal opportunity, UA to summarize thermal capability, and pressure drop to reveal flow-path changes. Together, these indicators tell a far clearer story than any one of them alone.
A heat exchanger is a coupled thermal and hydraulic system. Good troubleshooting respects both sides of that relationship.
Estimate performance loss by trending validated duty, driving force, and pressure drop at comparable conditions—then investigate the pattern before deciding to clean or modify the exchanger. 🧪🌡️🔧