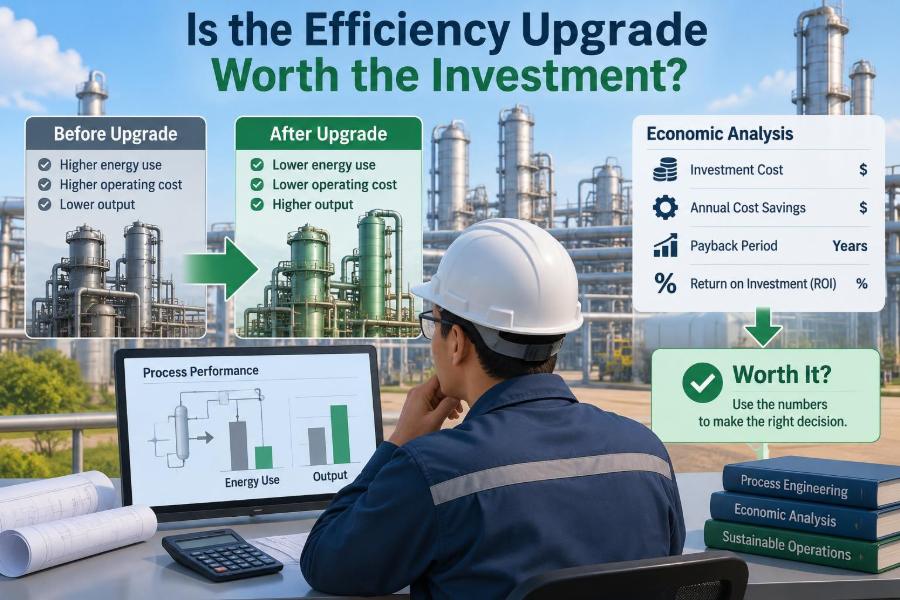

A plant team notices that a steam compressor is drawing more power than expected. The machine still runs, product quality is acceptable, and replacing it would interrupt production. Yet electricity bills, maintenance calls, and pressure to reduce emissions are all moving in the wrong direction.
The proposed fix may sound straightforward: install a higher-efficiency compressor, recover waste heat, add advanced controls, or replace an aging heat exchanger. But a lower energy number on a vendor datasheet does not automatically make a project a good investment.
Chemical plants make these decisions by connecting process engineering to finance. They estimate what the upgrade changes physically, translate those changes into annual cash flows, test the assumptions, and ask whether the return justifies the capital, risk, and operating disruption.
This is more than an accounting exercise. A disciplined evaluation prevents plants from rejecting valuable improvements because of a narrow payback calculation—or approving appealing projects whose promised savings disappear under real operating conditions.
🎯 Start With the Decision, Not the Equipment
An efficiency project should begin with a clearly defined decision: what problem is the plant trying to solve, and compared with what alternative? “Install a more efficient pump” is an equipment choice, not yet a business case.
The baseline alternative might be continued operation with routine repairs, a required replacement at end of life, or a different process redesign. The project must be compared against the realistic do-nothing or minimum-action case, not against an imagined plant with no costs.
For example, if a cooling-water pump must be replaced soon for reliability reasons, the extra cost of selecting a variable-speed design may be the relevant investment—not the full installed cost of the new pump.
🧭 Define the System Boundary
Plants first establish where the analysis starts and ends. A change that reduces electricity at one motor may increase steam consumption, cooling load, solvent loss, or downstream separation duty elsewhere.
A useful boundary includes all process units, utilities, and supporting systems materially affected by the upgrade. For a distillation modification, that may include the column, reboiler steam, condenser cooling water, reflux pump, vacuum system, and product-quality consequences.
Defining this boundary avoids a common error: claiming savings locally while shifting energy use or costs to another department.
📏 Build a Trustworthy Baseline
The baseline is the best estimate of current performance under comparable operating conditions. It is the denominator behind nearly every savings claim, so weak baseline data can make even sophisticated financial models misleading.
Teams may use historian data, utility meters, laboratory results, maintenance records, and production reports. They should reconcile measurements where possible: if a steam flow estimate conflicts sharply with the boiler balance, either the meter, assumption, or boundary needs attention.
A baseline should state the period used, normal operating range, production rate, feed properties, ambient effects, and known abnormal events. One unusually inefficient week is not a sound representation of a year.
🌦️ Normalize for Changing Conditions
Chemical plants rarely operate at one fixed rate. Throughput, product mix, feed composition, cooling-water temperature, and utility conditions can all change energy consumption without any equipment degradation.
Normalization adjusts the comparison so that like is compared with like. Electricity use might be expressed per tonne of product, while a furnace assessment may correct fuel use for feed rate and feed heating value.
Specific energy is useful, but it is not always sufficient. At low rates, fixed loads can make energy per tonne look worse even when equipment is operating properly. A model may need several variables rather than a single ratio.
⚙️ Identify the Physical Saving Mechanism
Before assigning a dollar value, engineers should be able to explain why the upgrade saves energy or materials. The mechanism should follow mass balances, energy balances, equipment curves, heat-transfer principles, or control behavior.
A variable-speed pump can reduce power because centrifugal pump power generally falls strongly as speed is reduced. A better heat exchanger can reduce steam demand by transferring more heat from a hot process stream to a cold one. Advanced control can reduce unnecessary safety margin and process variability.
If the mechanism cannot be explained, the predicted benefit is probably an untested assumption rather than an engineering estimate.
🔬 Use Process Models Carefully
Steady-state simulations, hydraulic calculations, pinch analysis, and equipment models are powerful tools for estimating changes before construction. They are especially useful when the project changes heat integration, separation performance, recycle flows, or utility balances.
But models are representations, not guarantees. Their outputs depend on thermodynamic methods, fouling assumptions, pressure drops, control constraints, and input data. A simulation predicting lower reboiler duty should be checked against practical limits such as tray capacity, exchanger area, and available steam pressure.
Good project teams document key assumptions and compare model predictions with plant data whenever a comparable operating condition exists.
💡 Separate Gross Savings From Net Savings
Gross savings describe the direct reduction in a cost category. Net savings account for everything else the project causes.
Suppose heat recovery cuts boiler fuel use but adds pumping power, periodic cleaning, and a small increase in cooling duty during bypass operation. The financial model should include all of those effects. The relevant result is not “fuel saved,” but annual net cash benefit.
| Potential benefit | Offset or associated cost to check |
|---|---|
| Lower steam demand | Electricity for pumps or fans; condensate system effects |
| Lower compressor power | Installation downtime; changed cooling requirement |
| Less solvent loss | Additional regeneration energy; analytical monitoring |
| Higher production rate | Raw materials, packaging, quality testing, market demand |
💰 Convert Utility Changes Into Real Costs
A kilowatt-hour, tonne of steam, or gigajoule of fuel becomes a financial benefit only when valued at the cost the plant actually avoids. This may differ substantially from a published average energy price.
For purchased electricity, the avoided cost can include energy charges and, in some cases, demand charges. For self-generated steam, the relevant cost depends on fuel, boiler efficiency, water treatment, condensate return, emissions controls, and whether the boiler capacity is constrained.
Using an average accounting rate can be acceptable for screening, but final approval often needs a marginal cost: the cost truly changed by the project at the expected operating condition.
🏭 Account for Capacity and Bottlenecks
Efficiency improvements can release capacity. Lower pressure drop may allow more throughput; reduced steam demand may free utility capacity; improved control may reduce off-spec material. These benefits can be valuable, but only if a real bottleneck is removed.
Consider a hypothetical evaporator upgrade that permits 5% more feed. The added production is not automatically profit. The team must check downstream drying capacity, tankage, packaging, raw-material supply, staffing, and most critically whether customers will buy the extra material.
Value capacity only to the extent that it produces incremental contribution margin, not simply more theoretical tonnes.
🛠️ Include Maintenance and Reliability Effects
Some upgrades save money mainly through fewer failures, reduced cleaning, lower spare-parts use, or longer run lengths. These benefits deserve consideration, but they should be estimated with the same care as energy savings.
Maintenance records can reveal frequency, labor hours, material costs, and production losses linked to recurring equipment problems. A redesigned exchanger that fouls less may create value through both lower utility use and fewer shutdowns.
Reliability benefits are often uncertain because failures are intermittent. It is sensible to show them separately and test the project with and without the most uncertain avoided-loss assumptions.
🧯 Price Safety, Environmental, and Compliance Impacts Responsibly
An upgrade may reduce emissions, flaring, hazardous waste, leak potential, or operator exposure. These outcomes can be decisive, particularly where the project addresses a required corrective action or a credible process-safety concern.
Not every benefit should be forced into a speculative dollar figure. Some obligations are non-negotiable, while some risk reductions are best presented qualitatively alongside the economic case.
Where costs are measurable—such as waste disposal, treatment chemicals, purchased emissions allowances, or monitoring requirements—they can enter the cash-flow model. The analysis should clearly distinguish certain avoided costs from uncertain risk valuation.
🏗️ Estimate Total Installed Cost
The purchase price of a pump, exchanger, or analyzer is only one part of capital cost. A credible estimate includes engineering, piping, foundations, electrical work, controls integration, insulation, testing, commissioning, training, and contingency appropriate to the project’s maturity.
Installation can dominate equipment cost in congested or hazardous areas. A heat exchanger may require lifting studies, structural modifications, tie-ins, temporary piping, insulation removal, and confined-space work.
Early estimates are necessarily uncertain. Rather than presenting a single number as exact, teams should state the estimate basis and update it as design information improves.
⏱️ Treat Downtime as a Project Cost
Many efficiency upgrades need a shutdown, production rate reduction, or temporary bypass. If the plant would already be down for a turnaround, the incremental downtime may be small. If the project requires a separate outage, it can dominate the economics.
The cost is not always lost sales; inventory may cover customers, or demand may be low. Still, planners must check production recovery capability, inventory carrying costs, contract commitments, and schedule risk.
Integrating a project with a planned turnaround often improves economics, but it can also increase turnaround complexity. The schedule needs a realistic critical-path review.
📅 Map Cash Flows Over Time
Capital is usually spent before benefits arrive. Engineering and long-lead equipment may require cash months before installation, while energy savings begin only after startup and stabilization.
A cash-flow forecast places capital spending, startup costs, operating costs, savings, tax effects where applicable, and eventual replacement or salvage effects into the years when they occur. This timing matters because a dollar received later is worth less than a dollar received now.
The model should also reflect ramp-up. A complex control upgrade may not deliver its full benefit on the first day because tuning, operator training, and process learning take time.
🧮 Understand Simple Payback
Simple payback estimates how long annual net savings take to recover initial investment:
Simple payback = Initial investment / Annual net cash savings
If a project costs $500,000 and is expected to save $125,000 per year, the simple payback is four years. It is quick, intuitive, and useful for preliminary screening.
Its limitation is equally clear: it ignores the time value of money, benefits after the payback point, and differences in project life. A project with a slightly longer payback may create far more long-term value.
📈 Use Net Present Value for Long-Term Value
Net present value (NPV) discounts future cash flows back to today and subtracts the initial investment. A positive NPV at the organization’s selected discount rate indicates that expected returns exceed that required return, under the model assumptions.
NPV = Σ [Cash flow in year t / (1 + r)^t] − Initial investment
Here, r is the discount rate and t is the time period. NPV is especially useful for comparing options with different capital costs, savings profiles, and operating lives.
The result depends on assumptions, so NPV should inform judgment rather than create false certainty. Consistent assumptions across competing projects are more useful than a precisely formatted spreadsheet with weak inputs.
📊 Know What Internal Rate of Return Can—and Cannot—Say
The internal rate of return (IRR) is the discount rate at which NPV becomes zero. It is often expressed as a percentage and can be compared with a company’s hurdle rate or cost of capital.
IRR is familiar, but it can be awkward when cash flows change direction more than once—for example, when a future decommissioning cost is large. It can also rank mutually exclusive projects differently from NPV.
For that reason, many teams report IRR alongside NPV and payback rather than relying on one metric alone.
🧾 Include Taxes, Depreciation, and Incentives When Relevant
At a detailed approval stage, finance teams may include taxes, depreciation, grants, rebates, and the timing of deductions. These can materially affect after-tax project value depending on the site and organization.
They should not be casually assumed. Eligibility rules, timing, documentation requirements, and future tax positions can change the outcome. A preliminary engineering estimate may use a simpler pre-tax analysis, clearly labeled as such.
The key is alignment: projects being compared should use the same financial convention and assumptions.
🎲 Test Sensitivity Instead of Trusting One Forecast
A base case is only one plausible future. Sensitivity analysis asks how the result changes when major uncertain inputs move: energy price, production rate, installed cost, savings magnitude, startup date, or maintenance expense.
A simple sensitivity table or tornado chart can show which assumptions matter most. If the project remains attractive when electricity prices and savings are both lower than expected, its case is stronger than one that succeeds only under an optimistic combination.
This exercise directs engineering effort toward the uncertainty worth reducing. There is little value refining a minor cost item while the expected outage duration remains poorly understood.
🔀 Develop Base, Upside, and Downside Cases
Scenario analysis changes several related assumptions together. A downside case might combine lower throughput, delayed startup, higher installation cost, and partial realization of savings. An upside case may reflect favorable utility prices and fast implementation.
Scenarios should be physically credible, not selected merely to produce dramatic answers. For example, a hot summer may simultaneously reduce cooling performance and alter electricity demand charges; treating those effects independently can miss their connection.
Decision-makers should see the base case, the credible downside, and the mitigation plan—not only the most attractive case.
🧪 Verify Vendor Claims at Plant Conditions
Vendor information is valuable, but stated efficiencies are often measured at specified conditions. A compressor map, pump curve, membrane flux, or exchanger duty may not match the site’s actual temperatures, fouling state, turndown, or control strategy.
Ask for performance guarantees, test conditions, exclusions, expected maintenance requirements, and references to comparable applications where appropriate. Compare design-point performance with expected operating distribution across the year.
A machine that is highly efficient at one point may deliver less benefit if the plant usually operates far from that point.
🧩 Check Controls and Human Factors
Hardware does not automatically produce savings. The control narrative, alarm strategy, operating procedures, and operator understanding determine whether equipment stays in its efficient operating window.
For instance, a variable-speed drive may save little if operators routinely override it to hold an unnecessarily high pressure. A heat-recovery loop may be bypassed because its control valve hunts or because startup instructions are unclear.
Include commissioning, tuning, training, and performance monitoring in the scope. These are not optional extras; they are part of converting design potential into sustained value.
🔍 Measure and Verify the Result
After startup, the project needs a measurement and verification plan. It should specify what will be measured, what baseline will be used, how operating changes will be normalized, who owns the data, and when performance will be reviewed.
For a motor project, measurements may include electrical power, flow, head, and production rate. For a furnace project, they may include fuel flow, feed rate, stack oxygen, feed temperature, and product specification.
Verification serves two purposes: it confirms savings for the business case and reveals operating issues early enough to correct them.
📉 Watch for Rebound and Hidden Constraints
Efficiency can sometimes encourage more use. If an air compressor has spare capacity after an upgrade, users may add unregulated air uses. If a distillation retrofit reduces steam demand, the plant may increase throughput until another limit appears.
This is not inherently bad; higher production may be desirable. But the benefit calculation must distinguish reduced energy per unit from total site energy and must recognize the new constraint.
Monitoring prevents a successful technical upgrade from being misreported as an underperforming energy project when operations have deliberately changed.
🚧 Avoid Double Counting Benefits
Projects often interact. A heat-integration project and a boiler-efficiency project may both claim the same reduction in fuel. A production increase and a yield improvement may both claim value from the same additional product.
Build an integrated site utility and production view, especially for a portfolio of projects. Assign ownership of each benefit and document dependencies between projects.
Double counting makes individual proposals look attractive but produces disappointment when site-level results do not match the sum of project promises.
🗂️ Compare Projects on More Than One Number
Plants typically have more good ideas than capital or engineering capacity. Ranking should consider NPV, payback, strategic fit, safety, compliance, outage opportunity, implementation risk, and confidence in savings.
A small project with modest NPV but no downtime requirement may deserve priority over a larger project that competes for a scarce turnaround window. Conversely, a mandatory safety upgrade should not be rejected simply because it lacks a conventional financial return.
A portfolio view also helps balance quick wins with larger projects that need more development.
🧱 Match Analysis Detail to Project Maturity
Early concepts need fast, transparent screening rather than elaborate models built on unknown inputs. As a project advances, the estimate should become more detailed, risks should be retired, and the financial case should be refreshed.
A sensible progression is:
- Concept screening using rough savings and installed-cost ranges.
- Feasibility work to confirm technical fit, utility interactions, and major hazards.
- Detailed engineering to refine scope, schedule, cost, controls, and verification plans.
- Post-startup review to compare actual results with the approved case.
This staged approach spends engineering effort where it can change the decision.
🤝 Bring Operations, Maintenance, and Finance Into the Room
Process engineers may understand the thermodynamics, but operators know where the plant actually deviates from the diagram. Maintenance teams know which equipment fouls, leaks, or fails. Finance teams ensure costs and return measures are applied consistently.
Involving these groups early exposes practical issues: inaccessible valves, unavailable spares, cleaning requirements, startup risks, or a production schedule that makes the planned installation impossible.
The strongest cases are not merely approved spreadsheets. They are shared plans that the people responsible for implementation believe can work.
🧠 A Practical Decision Checklist
Before approving an efficiency upgrade, decision-makers should be able to answer a short set of concrete questions:
- What is the baseline, and is it normalized for meaningful operating changes?
- What physical mechanism creates the expected saving?
- What are the net annual benefits after new loads, maintenance, and operating costs?
- What is the full installed cost, including outage and commissioning effects?
- How do NPV, payback, and downside scenarios compare with alternatives?
- Which assumptions have the greatest influence on the decision?
- How will performance be measured after startup?
If several answers are vague, the next step is usually not immediate approval or rejection. It is targeted engineering work to reduce the uncertainty that matters.
🏁 The Core Principle: Value the Whole Plant and the Whole Life
An efficiency upgrade is worth the investment when its expected, risk-adjusted life-cycle benefits exceed its full life-cycle costs and fit the plant’s operational realities. Energy reduction is often central, but it is only one component of value.
The calculation must follow the physical system first: establish a fair baseline, identify the mechanism, include interactions, and verify that the change can be operated reliably. Financial metrics then organize those results into a decision that can be compared with other uses of capital.
That discipline turns “this equipment looks more efficient” into a defensible answer to a much better question: what will this change do for the site over time?
The best efficiency investments are not the ones with the most impressive headline savings; they are the ones whose real, whole-plant benefits remain convincing after costs, uncertainty, and operating constraints are honestly counted. ⚙️📈🧪