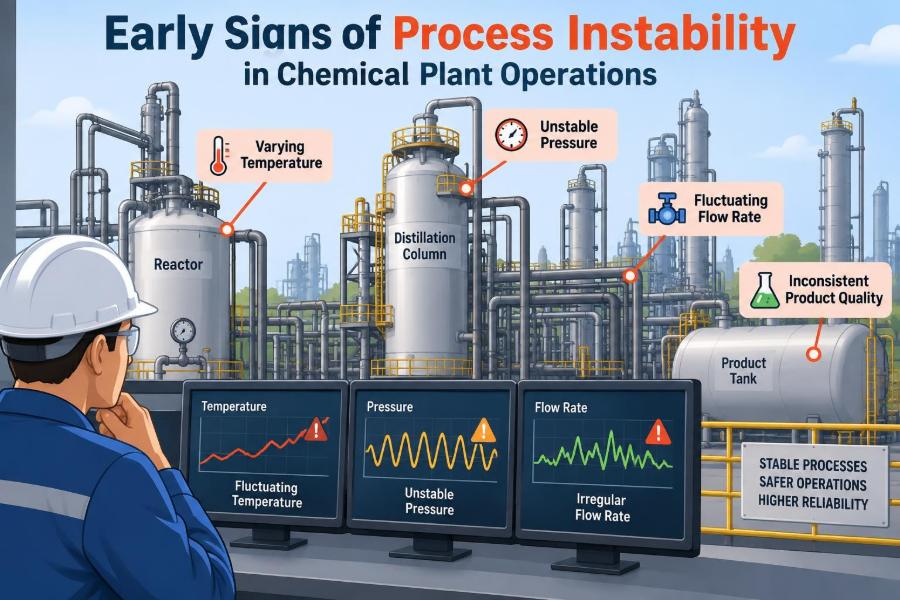

A distillation column is still on specification, but reflux flow is making small corrections more often than usual. A reactor temperature trend looks acceptable, yet the operator has needed several manual interventions during the shift. Nothing has tripped. Nothing has spilled. It would be easy to call the behavior “normal noise.”
Many process upsets begin this quietly. Before a plant reaches an alarm, a quality deviation, or a shutdown, it often shows a pattern of small departures from its usual operating rhythm.
Recognizing those departures is a core operating skill. It protects production, equipment, energy efficiency, product quality, and—most importantly—the layers of safety that depend on a process remaining within a controlled operating envelope.
Process instability is not always dramatic, and it does not always have one simple cause. The useful question is not merely “Is this variable in range?” but “Is the process behaving as it normally does, and is it becoming harder to control?”
🧭 What Process Instability Means
A stable process returns toward its intended operating condition after a small disturbance. If steam pressure changes briefly, for example, a well-tuned temperature-control loop should correct the resulting temperature movement without prolonged oscillation or excessive operator action.
Process instability occurs when disturbances grow, persist, repeat, or interact in a way that prevents the plant from settling. It can appear in a single control loop, an equipment item, or an entire connected unit.
Instability is not identical to an off-spec product or a high alarm. Those are possible outcomes. The early condition is often subtler: the process takes longer to recover, control valves move continuously, or related variables no longer move in their familiar relationship.
📈 Why “In Range” Can Be Misleading
Operating limits are essential safeguards, but a trend inside its limits is not automatically healthy. A reactor at its normal temperature may still be unstable if the cooling valve is cycling from nearly closed to nearly open every few minutes.
Think of driving a car down a lane. Remaining in the lane is the minimum requirement; repeatedly steering hard from side to side signals that something is wrong with the road, vehicle, or driver response. Control performance works similarly.
Operators should therefore consider both where a value is and how it is moving: its variability, rate of change, frequency of correction, and relationship to other process variables.
🌊 Rising Variability Is Often the First Clue
An increase in normal-looking fluctuation is one of the most useful early warning signs. Flow, pressure, level, temperature, composition, or utility demand may begin to wander over a wider band than is typical for that unit.
The change matters most when it is persistent. One noisy reading during a grade change may be expected. A gradual increase in variability during otherwise steady production deserves investigation.
Trend displays should use a time scale long enough to reveal the pattern. A few minutes may show noise; several shifts may reveal that the “noise” began after a raw-material delivery, maintenance activity, weather change, or production-rate increase.
〰️ Oscillation Reveals a Control Problem or Process Interaction
Oscillation is a repeating rise-and-fall pattern. It may be smooth and regular, irregular and damped, or sustained at roughly the same amplitude. A level loop that continually swings above and below set point is a familiar example.
Common contributors include aggressive controller tuning, valve stiction, delayed measurement response, changing process dynamics, and interaction between loops. In a coupled system, one controller can repeatedly undo another controller’s action.
The period of an oscillation can help narrow the search. Rapid cycling may point toward a valve, transmitter, or control configuration issue, while slower cycling may reflect inventory movement, heat-transfer delays, or upstream/downstream interactions. It is a diagnostic clue, not proof by itself.
🎛️ Controller Output That Never Rests
Control-loop output is often more revealing than the controlled variable alone. If a temperature remains near set point only because the controller output constantly hunts, the loop is working unusually hard.
Watch for output cycling, repeated reversals, unusually large moves, or output that slowly drifts toward a limit. Compare the behavior with similar historical operating periods rather than relying on an arbitrary amount of movement.
A controller in manual mode deserves context as well. Manual operation may be deliberate during startup, testing, or equipment limitations. But a growing number of loops placed in manual can indicate that automatic control is no longer coping with the process.
🚧 Control Valves Near Their Limits
A valve that spends long periods nearly fully open or fully closed has little remaining control authority. When a disturbance occurs, the controller cannot move the valve far enough in the needed direction to reject it.
Valve saturation can result from increased production, changed feed properties, inadequate utility pressure, fouling, a poorly sized valve, or a restriction in the line. It can also be created by an incorrect valve positioner signal or a mechanical problem.
Do not assume that 95% open always means failure. Some services are designed to operate near an end of travel. The concern is a change from the unit’s established normal behavior, especially when paired with poor control or rising energy demand.
🧱 Valve Stiction and Deadband
Stiction is static friction that keeps a valve from moving until the control signal changes enough to overcome resistance. The valve then jumps, often too far, and the controller reverses direction. This produces a recognizable cycling pattern.
Deadband is a range of input change that produces little or no valve response. Backlash in linkages, positioner problems, packing friction, and actuator issues can all contribute.
A practical sign is disagreement between controller output and measured valve position, or a valve position that moves in steps while the output changes smoothly. Maintenance and instrumentation teams should confirm the behavior with suitable testing; a trend alone cannot diagnose the mechanical cause with certainty.
🌡️ Temperature Drift and Heat-Balance Changes
Temperature drift often reflects a changing heat balance. A heat exchanger may be fouling, steam pressure may be fluctuating, a cooling-water supply may be warming, insulation may be damaged, or reaction heat release may have changed with feed quality.
In exothermic reactors, a rising temperature demand for cooling can be especially significant. The immediate temperature may remain controlled while the required cooling-valve position, coolant flow, or jacket temperature reveals declining thermal margin.
Operators should compare inlet and outlet temperatures, utility conditions, flow rates, and production rate. Treating the final temperature alone can conceal the mechanism causing the drift.
💨 Pressure Behavior That Changes Character
Pressure can become unstable through fluctuating vapor generation, compressor or pump problems, changing downstream resistance, vent restrictions, gas composition changes, or poorly coordinated pressure control.
Early signals include broader pressure swings, pressure-control output at a limit, recurring relief-header pressure changes, or a compressor operating closer to its control boundary. For rotating equipment, pressure behavior should be evaluated alongside flow, power, vibration, and recycle-valve activity.
A pressure rise is not merely a number to suppress. It may be evidence that material is accumulating, vapor is forming faster than it can leave, or the intended flow path is becoming restricted.
💧 Unexpected Level Movement and Inventory Imbalance
Levels are inventory indicators. A slowly rising vessel level means, in simple terms, that average inflow exceeds average outflow. A declining level indicates the reverse. The question is why the imbalance exists.
Repeated level surges can arise from foaming, gas entrainment, pump cycling, fluctuating upstream flow, poor transmitter performance, or changes in density. In distillation systems, level instability can disturb reflux, bottoms flow, and composition control.
Level control should not be judged only by its set point. A vessel level may appear stable because its outlet valve is continually making large corrections, passing instability downstream rather than resolving it.
🧪 Product Quality Moves Before It Fails
Laboratory results, online analyzers, and inferred quality measurements may show more scatter before the product becomes formally off specification. A widening spread in assay, moisture, color, density, or distillation properties can signal a loss of process robustness.
Analyzer readings need careful interpretation. A sample-system blockage, calibration issue, or analyzer maintenance requirement can imitate a process problem. Confirm unusual quality signals with independent evidence where practical.
When quality begins to wander, trace the likely process path backward: final separation, reactor conversion, feed ratio, temperature profile, utility stability, and raw-material properties. Correcting only the final quality controller may mask the real disturbance.
🔗 Broken Relationships Between Variables
Experienced operators learn expected relationships: increasing throughput usually raises a pump’s power demand; higher reflux typically affects a column temperature profile; greater steam flow should influence exchanger duty.
An early instability sign is when these relationships weaken or reverse without a clear operational reason. For example, higher cooling-water flow with no expected reduction in outlet temperature may suggest fouling, bypassing, an incorrect flow indication, or a changed thermal load.
This approach is especially valuable when individual tags remain within normal limits. Process understanding turns separate measurements into a coherent physical story.
🧫 Feedstock Variability Can Overwhelm a Stable Unit
Feed composition, viscosity, temperature, contaminants, water content, and particle size can alter process behavior. A unit designed around a narrow feed range may require different residence time, heat input, mixing, separation conditions, or additive rate when feed changes.
Instability after a tank changeover or supplier change is not automatically caused by the new material, but timing should prompt verification. Check receiving records, tank stratification, blend ratios, and available feed analyses.
Good feed-forward control can reduce the impact when the disturbance is measured early. If the property is unknown until it reaches the unit, operators may need conservative rates and closer monitoring while the process response becomes clear.
⚙️ Utility Disturbances Spread Quickly
Steam, cooling water, chilled water, instrument air, nitrogen, electrical supply, and fuel gas are often shared services. A disturbance in one utility system can appear as multiple unrelated process problems across the site.
For instance, reduced cooling-water performance can increase condenser pressure, alter column reflux behavior, reduce vacuum-system capacity, and increase reactor cooling demand. Seeing the common utility connection avoids repeated local adjustments that compete with one another.
Useful checks include supply pressure, supply and return temperatures, header demand, utility valve positions, and the timing of changes in neighboring units.
🌀 Pumps and Compressors Show Their Stress
Rotating equipment can both cause and suffer from instability. A pump with fluctuating suction pressure may cycle in flow, draw changing current, or show signs of cavitation. A compressor can respond to changing gas conditions with recycle activity, discharge-temperature shifts, or unstable flow.
Never diagnose machinery solely from a process trend. Mechanical condition monitoring, vendor operating maps, and site procedures are needed to assess equipment safely.
Still, operators should recognize that a noisy flow signal accompanied by unusual motor load and suction-level movement is more informative than any one signal alone. Connected evidence is stronger than isolated evidence.
🏭 Fouling Changes the Plant Slowly
Fouling is the gradual buildup of deposits on heat-transfer surfaces, filters, piping, catalyst beds, and internals. Its early effect is often subtle: more steam is needed for the same duty, pressure drop rises, or a valve moves farther to maintain the same flow.
Because fouling develops over days or weeks, shift-to-shift observation may miss it. Performance monitoring should compare like-for-like periods, accounting for throughput, feed conditions, and ambient effects.
Cleaning too early wastes availability; cleaning too late can force rate reduction, create unstable control, or increase risk during shutdown. The best trigger is an operationally meaningful performance trend, not a calendar date alone.
🧯 Alarm Floods Are a Symptom, Not a Strategy
A burst of alarms during a disturbance can overwhelm the operator’s ability to identify the initiating event. A nuisance alarm that repeatedly appears without requiring action also trains people to disregard it.
An alarm should communicate a condition requiring timely response. When alarms occur in cascades, the first meaningful deviation may be buried under consequential alarms.
Alarm management, rational set points, clear response guidance, and review of recurrent alarms improve early detection. The goal is not fewer alarms at any cost; it is alarms that help the operator recognize and manage genuine abnormal situations.
🖥️ Trend the Right Variables Together
Single-tag trends are useful, but instability is usually easier to understand when related variables are viewed together. Align them on a common time axis and include the controller mode and output when available.
A practical trend set for a heat exchanger might include process inlet and outlet temperatures, utility inlet and outlet temperatures, both flows, control-valve output, differential pressure, and production rate. The useful set depends on the equipment and control objective.
- Start before the suspected disturbance, not at the first alarm.
- Use both short and long time windows.
- Mark grade changes, maintenance actions, sampling times, and operator interventions.
- Look for sequence: which variable moved first?
Sequence does not prove causation, but it directs a more disciplined investigation.
📊 Use Baselines Rather Than Guesswork
“Normal” should be documented whenever practical. A baseline may include typical ranges, variability, valve positions, energy use, pressure drops, and response to known production rates.
The comparison must be fair. A column at high throughput should not be expected to match the exact pressure profile of low-rate operation. Baselines can be organized by product grade, rate, season, feed source, or equipment configuration.
Simple operating envelopes are often more usable than overly complex models. The purpose is to help people notice meaningful change early, not to create a spreadsheet that no one can interpret during a busy shift.
🧠 Distinguish Process Noise from a Real Trend
Every measurement contains some variation. Instrument resolution, turbulence, sampling delays, control action, and normal feed changes all create noise. Reacting to every small movement can make a stable process less stable.
A credible concern usually has one or more of these features:
- It persists across several observations or shifts.
- It appears in more than one related variable.
- It requires increasing controller or operator effort.
- It differs from comparable historical operation.
- It has a plausible physical mechanism.
This is why verification matters. Check instrument health and operating context before making large process changes.
🛠️ Instrument Problems Can Mimic Instability
A plugged impulse line, drifting transmitter, sticking analyzer sample valve, poor thermowell location, electrical noise, or incorrect scaling can create false evidence of a process upset. An unstable measurement can drive a controller into unnecessary action.
Cross-check suspicious signals with redundant measurements, local indicators, material balances, equipment observations, and process consequences. If flow supposedly doubled but pump power, valve position, and downstream level did not change, the measurement needs scrutiny.
Do not bypass an instrument or force a value casually. Such actions can remove protection or hide a developing fault. Follow the plant’s management, maintenance, and safety procedures.
🧩 Control-Loop Interaction Is Easy to Miss
Many loops share the same process inventory or energy source. A pressure controller may manipulate vapor flow that changes condenser duty; a temperature controller may alter steam demand and affect a header used elsewhere; a level controller may influence residence time and composition.
Interaction becomes visible when one loop begins oscillating after another loop moves, or when two controller outputs repeatedly move in opposite directions. Cascade and ratio strategies can improve coordination, but only when measurements, tuning, and process assumptions remain valid.
Changing controller tuning without understanding the interaction can shift the instability rather than eliminate it. Review the control narrative and operating intent before modifying settings.
👷 Human Actions Can Add Variability
Operators often intervene for good reasons: protect limits, meet quality targets, compensate for equipment constraints, or manage a changing feed. Yet frequent manual changes, especially by different shifts, can create a moving target for the control system.
Clear operating targets, shift communication, and recorded rationale help distinguish necessary action from habitual adjustment. A note such as “reduced rate because filter differential pressure rose” provides far more value than “adjusted flow.”
Stable operation does not mean operators never intervene. It means interventions are intentional, coordinated, and based on process evidence rather than repeated attempts to chase a noisy signal.
🧾 Build an Escalation Path Before the Upset
Early warnings are most valuable when people know what to do with them. A practical response path defines what the operator can verify, when to notify supervision or engineering, what operating limits apply, and when rate reduction or an orderly shutdown is required.
Procedures should be unit-specific. The response to rising exchanger pressure drop differs from the response to increasing reactor temperature variability, even though both can be early instability signals.
Useful escalation information includes the observed trend, time of onset, current operating mode, recent changes, actions already taken, and relevant supporting tags. This allows the next person to assess the situation without reconstructing the entire shift.
🧪 A Disciplined First Response
When instability is suspected, avoid the temptation to make several large changes at once. That can erase useful evidence and introduce new disturbances.
- Confirm the measurement and check for obvious instrument or communication issues.
- Assess safety margins, operating limits, and applicable procedures first.
- Identify what changed before the behavior began: feed, rate, utilities, lineup, maintenance, or controller mode.
- Trend related variables and determine the likely sequence of events.
- Make only authorized, purposeful adjustments and observe the response.
- Escalate when the cause is unclear, margin is shrinking, or the response is ineffective.
This sequence is not a substitute for site procedures. It is a way to organize attention during an uncertain situation.
📚 Learn From Near-Misses and Small Upsets
A recovered upset can reveal weaknesses that would otherwise remain hidden: a poorly located temperature sensor, an unclear alarm response, an undersized utility valve, incomplete shift logs, or a feed-quality blind spot.
Post-event review should focus on learning rather than blame. Ask what signals were available, which ones were noticed, what delayed recognition, and what design or work-process change would make the next response easier.
Small events are especially valuable because the plant is still intact enough to preserve evidence. Trends, samples, operator observations, maintenance records, and control-system history should be reviewed before they are overwritten or forgotten.
⚖️ Avoid Overcorrection and False Confidence
Not every fluctuation requires a change, and not every successful correction identifies the root cause. A manual adjustment may restore a variable temporarily while the underlying equipment or feed issue continues to develop.
Likewise, aggressive control tuning can reduce visible deviation while increasing valve wear, utility swings, or sensitivity to delays. The best control response balances speed, smoothness, equipment limits, and the consequences of deviation.
Stability is not maximum tightness around set point. It is predictable, controllable behavior with adequate margin to handle realistic disturbances.
🔍 A Practical Shift-Round Mindset
During field rounds and control-room monitoring, look for change rather than only absolute abnormality. Is a valve sounding different? Is a pump recycle line warmer than usual? Has a controller been in manual longer than expected? Are operators discussing the same minor issue every shift?
Field observations can validate digital data. A transmitter may report a stable level while foam, vibration, unusual noise, leakage, or changing sight-glass behavior suggests that the measurement does not tell the whole story.
Good rounds connect senses, local indications, trends, and process knowledge. They are not simply a checklist exercise.
🧱 The Core Principle: Preserve Operating Margin
Early signs matter because they reveal the loss of margin before a limit is crossed. Rising valve position, increasing utility demand, wider temperature swings, growing pressure drop, and repeated manual action all suggest that the process has less ability to absorb the next disturbance.
The most effective response combines attentive operations, reliable instrumentation, sound control design, equipment maintenance, and clear escalation practices. No single dashboard or alarm can replace that system of defenses.
When teams treat small behavioral changes as information—not inconvenience—they can investigate while choices remain available. That is the practical value of early instability detection.
A stable chemical plant is not one that never changes; it is one where changes are recognized, understood, and managed before they consume the operating margin. 🧪📈🛡️