
Chemical plants consume enormous amounts of energy. Reactors must be heated, distillation columns require steam, process streams need cooling, and utilities such as boilers, furnaces, chillers, and cooling towers operate continuously. In many facilities, energy is one of the largest operating costs. 🏭⚡
Yet a surprising amount of that energy can be wasted when hot process streams are cooled while other process streams are being heated independently.
Imagine one stream leaving a reactor at 180°C and needing to be cooled to 60°C. At the same time, another feed stream enters the plant at 30°C and must be heated to 140°C.
A poorly integrated plant might use cooling water to remove heat from the first stream and steam to heat the second.
That means the facility is effectively throwing away heat in one place while purchasing heat somewhere else.
Pinch analysis provides a systematic way to identify these opportunities and determine the minimum amount of external heating and cooling a process theoretically requires. 🔥❄️
Instead of looking at individual heat exchangers one at a time, pinch analysis examines the entire process as an integrated thermal system.
The result can be lower fuel consumption, reduced cooling demand, smaller carbon emissions, and significant operating-cost savings.
🧠 What Is Pinch Analysis?
Pinch analysis is a methodology used to improve heat integration in industrial processes.
Its main purpose is to answer questions such as:
- How much external heating does the plant really need?
- How much external cooling is unavoidable?
- Which hot and cold streams should exchange heat?
- Where are inefficient heat-exchanger connections occurring?
- How close is the existing plant to its theoretical energy optimum?
The approach was developed from thermodynamic principles and became an important part of process integration engineering.
At its core, pinch analysis separates plant energy demand into two categories:
🔥 Hot utility — energy supplied to the process, such as steam, hot oil, or furnace heat.
❄️ Cold utility — energy removed from the process, such as cooling water, refrigeration, or air cooling.
The objective is to maximize heat recovery between process streams so that both utility requirements become as small as practical.
🌡️ Hot Streams and Cold Streams
Pinch analysis starts by identifying streams that must change temperature.
A hot stream is a process stream that needs to be cooled.
Examples include:
- Reactor products
- Condensed vapors
- Hot distillation bottoms
- Furnace effluent
- Compressor discharge streams
A cold stream is a process stream that needs to be heated.
Examples include:
- Reactor feeds
- Boiler feedwater
- Distillation column feeds
- Raw material streams
- Preheated fuel or combustion air
Each stream is characterized by information such as:
📌 Supply temperature
📌 Target temperature
📌 Flow rate
📌 Heat capacity
📌 Phase-change behavior
📌 Heating or cooling duty
Engineers use these data to determine how much heat each stream can give or receive.
🔥 A Simple Example of Wasted Energy
Consider a simplified chemical plant.
Stream A leaves a reactor at:
200°C
and must be cooled to:
80°C.
Meanwhile, Stream B enters another unit at:
40°C
and must be heated to:
150°C.
Without heat integration, engineers might install:
Stream A → cooler → cooling water
and:
Steam heater → Stream B
This arrangement consumes steam while simultaneously rejecting useful heat.
Pinch analysis asks:
Can Stream A transfer some of its heat directly to Stream B?
If the answer is yes, a process-to-process heat exchanger could recover energy.
Now the configuration becomes:
Hot Stream A 🔥 → heat exchanger → Cold Stream B
The hot stream cools while the cold stream heats.
As a result:
✅ Less steam is needed
✅ Less cooling water is needed
✅ Boiler fuel consumption falls
✅ Cooling tower load decreases
One heat exchanger can therefore reduce energy consumption on both sides of the process.
📊 The Composite Curve Concept
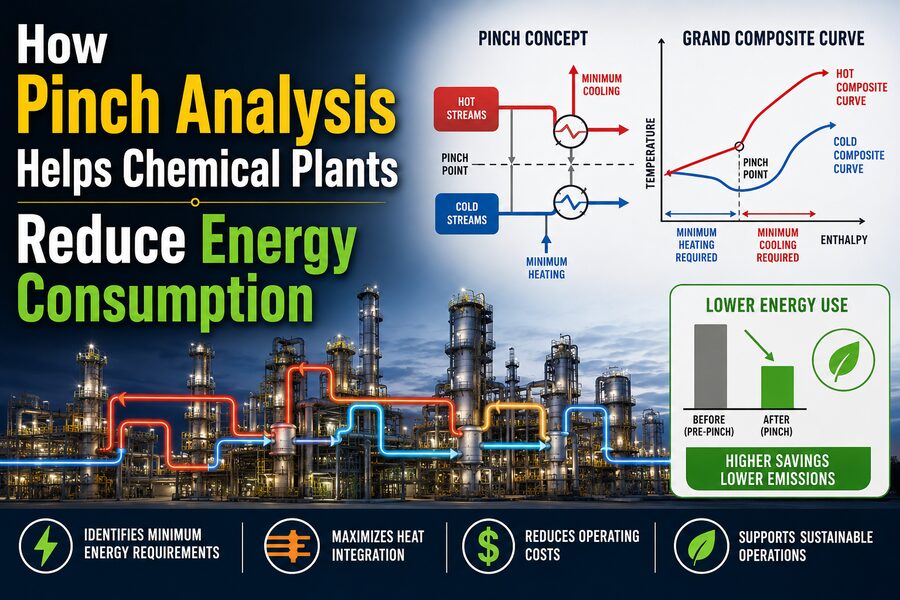
One of the most important tools in pinch analysis is the composite curve.
Instead of studying every individual hot stream separately, engineers combine all hot streams into a single thermal representation called the:
Hot Composite Curve
Similarly, all cold streams are combined into the:
Cold Composite Curve
These curves are commonly plotted on a graph of:
Temperature vs. Enthalpy
or temperature versus heat duty.
The hot composite curve shows how much heat the process can release as its hot streams cool.
The cold composite curve shows how much heat the process requires as cold streams heat up.
Placing these curves together reveals how much heat can potentially be recovered internally. 📈
↔️ What Is ΔTmin?
Heat cannot flow effectively between two streams at exactly the same temperature.
There must be a temperature difference driving heat transfer.
In pinch analysis, engineers specify a minimum allowable temperature approach known as:
ΔTmin
pronounced “delta T minimum.”
Suppose:
ΔTmin = 20°C
Then the hot stream should remain at least approximately 20°C hotter than the cold stream at the closest approach, depending on the temperature-shifting convention being used.
The choice of ΔTmin is extremely important.
A smaller ΔTmin allows more heat recovery because hot and cold streams can approach each other more closely in temperature.
However, achieving a smaller temperature difference usually requires:
🧱 Larger heat exchangers
💰 Higher capital cost
📐 More heat-transfer surface area
A larger ΔTmin reduces exchanger size but increases utility demand.
Therefore, engineers must balance:
Capital cost vs. energy cost
This economic optimization is one of the practical strengths of pinch analysis.
🤏 What Exactly Is the “Pinch”?
When the hot and cold composite curves are moved toward each other while maintaining the required minimum temperature difference, they eventually reach their closest permitted approach.
That region is called the pinch point.
The pinch acts like a thermodynamic bottleneck in the heat-recovery system.
It divides the process into two regions:
🔥 Above the Pinch
The process generally requires a net input of heat.
❄️ Below the Pinch
The process generally requires a net rejection of heat.
Understanding this division leads to some extremely powerful design rules.
🚫 The Three Classic Pinch Rules
For an ideal minimum-energy heat-exchanger network, engineers follow three famous principles.
1️⃣ Do Not Use External Cooling Above the Pinch
Above the pinch, the process already lacks heat.
If a hot stream is cooled using cooling water in this region, valuable heat is being discarded.
That heat could potentially have been used to warm another process stream.
Therefore:
No cooling utility above the pinch.
2️⃣ Do Not Use External Heating Below the Pinch
Below the pinch, the process already has excess heat that needs to be removed.
Using steam or another hot utility in this region increases both heating and cooling requirements unnecessarily.
Therefore:
No heating utility below the pinch.
3️⃣ Do Not Transfer Heat Across the Pinch
Heat transferred from above the pinch to below the pinch effectively moves valuable heat away from the region where it is needed.
This forces the plant to add extra heating above the pinch and extra cooling below it.
Therefore:
No heat transfer across the pinch in the ideal minimum-energy design.
These three rules form the conceptual foundation of pinch-based heat exchanger network design.
🧮 Energy Targeting Before Designing Equipment
One of the greatest advantages of pinch analysis is that engineers can estimate minimum energy requirements before designing the detailed heat-exchanger network.
This is called energy targeting.
Pinch calculations can estimate:
🔥 Minimum hot utility requirement — QH,min
❄️ Minimum cold utility requirement — QC,min
These represent the theoretical minimum external heating and cooling demands for the chosen ΔTmin.
Suppose an existing chemical plant consumes:
100 MW of steam heating
but pinch analysis indicates:
QH,min = 70 MW
The difference suggests that approximately:
30 MW
of heating demand may be associated with recoverable process inefficiencies, subject to practical constraints.
That gives engineers a powerful benchmark.
Instead of vaguely asking, “Can we save energy?” they can ask:
“Why is our plant consuming 30 MW more than the calculated minimum?”
🎯 This makes energy improvement much more targeted.
💧 The Problem Table Algorithm
Composite curves provide a graphical understanding, but engineers can also calculate energy targets numerically using the Problem Table Algorithm, sometimes referred to as a heat cascade.
The basic process involves:
- Adjusting stream temperatures to account for ΔTmin
- Dividing the temperature range into intervals
- Calculating heat surpluses or deficits within each interval
- Cascading heat from high temperature to low temperature
- Identifying the minimum external heating needed to avoid negative heat availability
The point where the heat cascade reaches zero corresponds to the pinch region.
This method allows engineers to calculate utility targets systematically, even for processes involving many streams.
🏭 Designing a Heat Exchanger Network
Once the energy targets and pinch location are known, engineers can design or modify the Heat Exchanger Network, commonly abbreviated as HEN.
A HEN may include:
- Process-to-process exchangers
- Steam heaters
- Reboilers
- Feed preheaters
- Condensers
- Cooling-water exchangers
- Air coolers
- Refrigeration exchangers
The goal is to connect hot and cold streams so that the network approaches the minimum utility requirements while remaining practical.
Engineers must also consider:
🔧 Pressure drop
🧪 Corrosion
🧹 Fouling
⚠️ Contamination risk
📏 Equipment layout
💰 Capital cost
🛠️ Maintainability
🎛️ Process control
🚨 Safety
The thermodynamically ideal network is not always the most practical plant design.
Pinch analysis provides the target; engineering judgment determines how closely the real plant should approach it.
💰 Pinch Analysis Balances Energy and Capital Cost
Maximum heat recovery does not automatically mean minimum total cost.
Imagine reducing ΔTmin from:
30°C to 5°C
The plant might recover much more heat.
However, very small temperature differences require very large heat-exchanger areas.
Capital cost could rise dramatically.
Conversely, choosing:
ΔTmin = 50°C
might make heat exchangers relatively inexpensive but force the plant to consume much more steam and cooling water.
Engineers therefore perform total annual cost optimization.
A simplified economic objective is:
Total Cost = Annualized Capital Cost + Annual Utility Cost
The best ΔTmin is often near the point where these competing costs produce the lowest overall expenditure. ⚖️
🛠️ Pinch Analysis Is Especially Useful for Existing Plants
Pinch analysis is not limited to new facilities.
It can be extremely valuable in retrofit projects.
Existing chemical plants often contain heat-exchanger networks that developed gradually over decades.
A new production unit may have been added.
A reactor may have been debottlenecked.
Steam pressures may have changed.
Equipment might have been replaced.
Eventually, the heat-recovery network may no longer be thermally optimized.
Pinch analysis can identify:
🔍 Exchangers operating across the pinch
🔥 Excessive steam use below the pinch
❄️ Unnecessary cooling above the pinch
🔄 Opportunities to reroute streams
♻️ Heat currently being rejected that could be recovered
Engineers can then prioritize modifications according to cost and expected energy savings.
♨️ Reducing Steam Consumption
Steam is one of the most common heating utilities in chemical plants.
Producing steam requires fuel.
A boiler may burn:
🔥 Natural gas
🛢️ Fuel oil
♻️ Process off-gases
🌱 Biomass or other fuels
If pinch analysis reduces steam demand, the boiler burns less fuel.
This can lower:
💰 Fuel cost
🌍 Carbon dioxide emissions
💧 Boiler feedwater consumption
🧪 Water-treatment chemical use
⚙️ Boiler load
The savings therefore extend beyond the immediate process heater.
❄️ Reducing Cooling Demand
Better heat recovery also reduces the amount of heat that must ultimately be rejected.
This can decrease load on:
💧 Cooling towers
🌬️ Air coolers
❄️ Refrigeration systems
⚙️ Cooling-water pumps
Reducing refrigeration demand can be especially valuable because generating low-temperature cooling often consumes large amounts of electricity.
Pinch analysis can therefore save both thermal energy and electrical energy.
🏗️ Distillation Plants Can Benefit Significantly
Distillation is one of the most energy-intensive operations in the chemical industry.
A conventional distillation column typically contains:
🔥 A reboiler that supplies heat
and:
❄️ A condenser that removes heat.
Large plants may contain dozens or even hundreds of columns.
Pinch analysis helps engineers examine whether heat rejected by condensers or hot process streams can be reused elsewhere.
Examples might include:
- Preheating column feeds
- Heating lower-temperature reboilers
- Generating low-pressure steam
- Heating utility water
- Integrating neighboring process units
When temperature levels are suitable, these connections can significantly reduce overall utility consumption.
🪜 Utility Levels Matter, Not Just Energy Quantity
Not all heat has the same usefulness.
One megawatt of heat available at 250°C is more versatile than one megawatt available at 50°C.
High-temperature heat can potentially satisfy both high-temperature and low-temperature demands.
Low-temperature heat cannot easily perform high-temperature duties.
Pinch analysis therefore considers temperature quality, not merely energy quantity.
Chemical plants may use several utility levels, such as:
🔥 High-pressure steam
♨️ Medium-pressure steam
🌡️ Low-pressure steam
💧 Hot water
❄️ Cooling water
🧊 Refrigeration
Advanced pinch methods can determine how much of each utility level should ideally be used.
This prevents high-value high-pressure steam from being wasted on heating duties that low-pressure steam could handle.
🔄 Grand Composite Curves
A useful extension of composite curves is the Grand Composite Curve, or GCC.
The GCC shows how the net heat surplus or deficit changes with temperature after maximum process-to-process heat recovery has been considered.
It helps engineers visualize where utilities should enter or leave the process.
For example, the GCC can reveal opportunities for:
♨️ Steam generation
🔥 Multiple steam pressure levels
❄️ Refrigeration optimization
⚡ Heat pumps
🌀 Heat engines
💧 Hot-water systems
This makes the Grand Composite Curve particularly useful for designing the plant’s overall utility system.
🔋 Pinch Analysis and Heat Pumps
Sometimes excess heat exists below the pinch at a temperature too low to be directly useful above the pinch.
A heat pump can potentially upgrade that heat.
The heat pump consumes electrical or mechanical energy to raise heat from a lower temperature to a higher temperature.
Pinch analysis can help determine whether such a system is thermodynamically well positioned.
A poorly located heat pump may provide little benefit.
A correctly integrated heat pump can reduce both:
🔥 Hot utility demand
and:
❄️ Cold utility demand.
This becomes increasingly relevant as chemical plants explore electrification and lower-carbon energy systems. ⚡🌱
🌍 Pinch Analysis Can Reduce Carbon Emissions
Energy efficiency and emissions are closely connected.
If a chemical plant burns less natural gas to generate steam, it generally produces less carbon dioxide.
Suppose better heat integration reduces fuel demand by thousands of gigajoules per year.
The associated emissions savings can be substantial.
Pinch analysis therefore supports objectives such as:
🌱 Energy efficiency
🌍 Carbon reduction
💰 Cost reduction
⚡ Electrification planning
♻️ Waste-heat recovery
The technique is particularly valuable because it identifies reductions that come from using existing energy more intelligently rather than simply purchasing additional energy technologies.
🧩 More Than Heat: Other Forms of Pinch Analysis
The ideas behind thermal pinch analysis have inspired broader process-integration techniques.
Examples include:
💧 Water pinch analysis — minimizing fresh-water consumption and wastewater generation.
🧪 Hydrogen pinch analysis — optimizing hydrogen production and reuse in refineries.
⚡ Power and energy integration — coordinating different energy sources and demands.
🌍 Carbon-constrained process integration — evaluating energy choices alongside emissions targets.
The common idea is to identify resource surpluses, resource deficits, and the fundamental bottleneck—or “pinch”—that limits further reuse.
📊 A Simple Plant-Level Illustration
Imagine a chemical facility initially requiring:
120 MW of hot utility
and:
100 MW of cooling utility.
Pinch analysis reveals that better heat recovery could reduce these targets to:
80 MW of hot utility
and:
60 MW of cooling utility.
If practical modifications allow the plant to approach those targets, it could avoid roughly:
🔥 40 MW of purchased heating
and:
❄️ 40 MW of cooling duty.
The actual financial savings depend on fuel prices, equipment costs, operating hours, and achievable retrofit design.
But this example illustrates an important concept:
Every unit of process heat recovered can potentially reduce both a heating requirement and a cooling requirement.
That dual benefit is one reason heat integration projects can be economically attractive.
⚠️ Why Plants Cannot Always Reach the Theoretical Minimum
Pinch analysis calculates what is thermodynamically possible under certain assumptions.
Real plants face constraints.
For example:
🧪 Two streams may not be allowed to exchange heat because contamination would create a safety risk.
📏 Equipment may be located hundreds of meters apart.
🧱 An exchanger may require too much surface area.
🧹 Fouling fluids may create severe maintenance problems.
⚙️ Pressure-drop limits may restrict exchanger designs.
🎛️ Startup and shutdown conditions may require independent heaters and coolers.
💰 Retrofit piping may cost more than the recovered energy is worth.
Therefore, the objective is not necessarily to achieve the theoretical minimum at any cost.
The purpose of pinch analysis is to provide a thermodynamic benchmark that engineers can compare against practical and economic constraints.
🚀 Why Pinch Analysis Remains Important
Modern chemical plants are under pressure to produce more while consuming less energy.
At the same time, industries are seeking lower greenhouse-gas emissions and more efficient use of electricity, steam, cooling water, and fuel.
Pinch analysis provides a rigorous framework for answering a critical question:
Before building additional energy infrastructure, are we already using the heat inside the process as effectively as possible?
That question can reveal opportunities hidden inside complex networks of pipes, exchangers, reactors, and columns.
With modern simulation software, engineers can combine pinch analysis with:
💻 Process simulation
📊 Economic optimization
🌍 Emissions modeling
⚡ Electrification studies
🧠 Advanced optimization algorithms
🏭 Digital plant models
This allows energy integration to be considered much earlier and more systematically during plant design.
✅ Conclusion
Pinch analysis helps chemical plants reduce energy consumption by treating the facility as a connected thermal system rather than a collection of separate heaters and coolers.
Engineers identify hot streams that need cooling and cold streams that need heating, determine how much heat can be exchanged internally, establish a minimum temperature approach, and locate the crucial pinch point.
From there, they calculate the minimum required hot and cold utilities and design heat-exchanger networks that recover as much useful process heat as practical. ♨️🔄❄️
The most important insight is simple:
Do not throw useful heat away while purchasing more heat somewhere else.
By following that principle systematically, pinch analysis can reduce steam consumption, cooling demand, boiler fuel use, refrigeration power, operating costs, and carbon emissions.
In a large chemical facility, where enormous quantities of heat move through the process every hour, even modest improvements in heat recovery can translate into major savings. 🏭💰🌱
Pinch analysis therefore remains one of the most powerful examples of how thermodynamics can be converted directly into better industrial efficiency.