
A production report says the plant made less product than planned. The immediate reaction is often to look at the reactor: perhaps the temperature was wrong, the catalyst weakened, or the chemistry simply underperformed.
Sometimes that is exactly the problem. But low yield can also be created by a leaking transfer line, an unrepresentative laboratory sample, product retained in a filter cake, an inventory error, or a specification change that silently reclassifies usable material as off-grade.
That is why yield investigations are more than troubleshooting exercises. They connect chemistry, equipment, measurements, operations, economics, and safety into one disciplined question: where did the material go?
For engineers, the goal is not to find a convenient explanation. It is to build an evidence-based account of every meaningful input, output, accumulation, and loss—then correct the mechanism that actually limits performance.
🎯 Start by Defining What “Poor Yield” Means
Yield is often used loosely, but different calculations answer different questions. A reaction yield compares actual product with the theoretical amount predicted by stoichiometry. A recovery yield asks how much material entering a separation step is recovered. Overall plant yield combines many steps and may include quality losses, handling losses, and recycle effects.
Before investigating, write a precise statement such as: “Overall isolated product yield per unit of fresh feed declined relative to the established operating baseline.” This prevents a team from comparing incompatible numbers.
🧮 Separate Conversion, Selectivity, and Recovery
A reactor may consume most of its limiting reactant yet still produce little desired product. That distinction becomes clear through three related measures:
- Conversion: fraction of a reactant consumed.
- Selectivity: fraction of consumed reactant that forms the desired product rather than by-products.
- Recovery: fraction of desired material physically captured after it has formed.
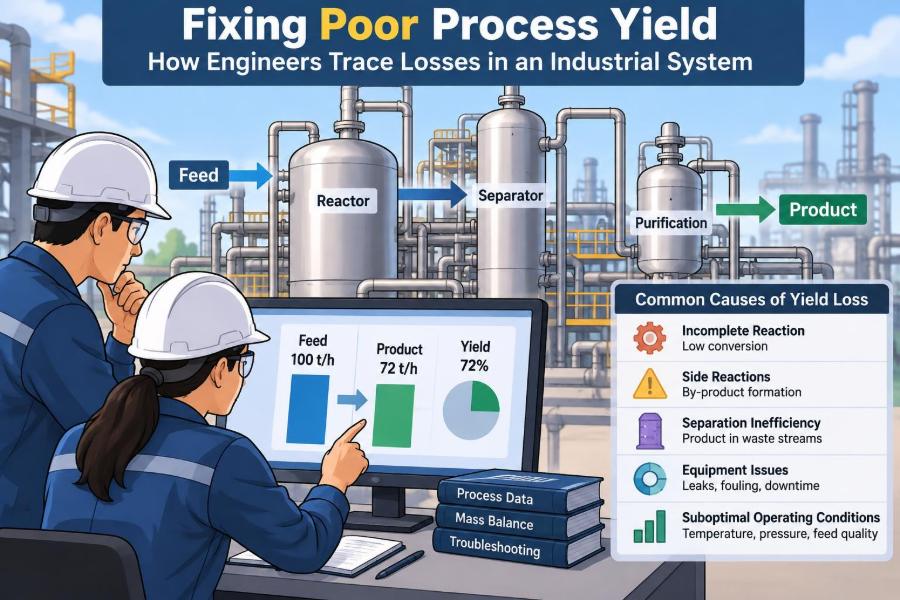
High conversion with low selectivity points toward reaction chemistry. High conversion and selectivity with low recovery directs attention downstream, such as filtration, distillation, extraction, drying, or packaging.
📏 Choose the Right Yield Boundary
Every yield has a boundary. A batch yield may start at charged raw materials and end at final packaged product. A unit-operation yield may begin with feed to a centrifuge and end with recovered wet solids. Both can be valid, but they should not be mixed.
Draw the process boundary on a simplified flowsheet and label all streams crossing it. Include expected product, by-products, purge streams, aqueous streams, vents, samples, slops, and material held inside equipment.
⚖️ Make a Material Balance the Investigation Backbone
The general material-balance relationship is simple: input minus output plus generation minus consumption equals accumulation. For a chemical species, generation and consumption arise from reaction; for total mass, chemical reaction changes composition but not total mass.
A batch balance may be written as:
Input + material initially present = Output + material remaining + unaccounted difference
The “unaccounted difference” is not automatically a real loss. It is a signal to examine measurements, sampling, timing, and assumptions before drawing conclusions.
🗺️ Build a Loss Map Before Collecting More Data
A loss map lists every credible destination for material. It is more effective than beginning with a favorite theory, because it makes overlooked pathways visible.
- Desired product in a saleable stream
- Product in mother liquor, filtrate, wash water, or raffinate
- By-products, degradation products, and impurities
- Material sent to flare, vent treatment, wastewater, or solid waste
- Residue in vessels, lines, filters, dryers, and containers
- Inventory changes and measurement uncertainty
Then rank pathways by likely magnitude, ease of verification, safety relevance, and cost of testing.
🔍 Verify That the Yield Drop Is Real
A single poor result is not necessarily a process shift. Check whether the calculation used the correct recipe version, bill of materials, assay basis, density, moisture correction, and product-quality disposition.
For example, a product reported on a wet-mass basis can appear to lose yield if its moisture specification changes. Likewise, a new laboratory method may report a different assay than the previous method without any change in actual process performance.
🧾 Reconcile Production Records and Laboratory Data
Operations records describe what was charged, transferred, drained, and packaged. Laboratory data describe composition. Neither alone closes a chemical balance.
Reconciliation means putting them on compatible bases: common units, common timestamps, and a clearly stated dry, wet, pure-component, or as-is basis. A tank level converted using an outdated density can introduce an apparent loss large enough to send an investigation in the wrong direction.
🧪 Check Sampling Before Blaming the Process
A sample is only useful if it represents the stream. Settling solids, stratified liquid layers, droplets in gas lines, or intermittent flow can make a grab sample misleading.
Ask where, when, and how samples were taken. Was the line mixed? Was the sample point flushed? Did the sample container preserve volatile or reactive components? Were duplicate samples consistent? A good analytical method cannot repair a bad sample.
📊 Understand Measurement Uncertainty
Flowmeters, weigh scales, level transmitters, density measurements, and assays all have uncertainty. When a balance discrepancy is small relative to the combined uncertainty of these measurements, it may not identify a physical loss at all.
This does not mean uncertainty should become an excuse to ignore a gap. It means the team should distinguish a persistent, meaningful deviation from normal measurement scatter. Repeated balances across several campaigns are usually more informative than one calculation.
🏭 Establish a Baseline From Good Campaigns
The most useful comparison is often not a generic design value but prior operation that met quality, safety, and throughput expectations. Select comparable campaigns with similar feedstocks, equipment configuration, product grade, and operating mode.
Compare distributions rather than relying only on an average. A process with occasional severe losses may need a different solution from one whose yield has shifted downward steadily.
🧬 Examine Feedstock Quality and Assay
Fresh-feed quantity is not the same as fresh-feed quality. Water, inert material, incorrect active concentration, contaminants, and degraded raw materials change the amount of reactive component actually introduced.
A hypothetical solvent-borne reagent may arrive with higher water content than usual. If operators charge the same mass, the batch receives less active reagent and more water, potentially changing both stoichiometry and phase behavior. Correcting the balance to active-component basis can reveal the true mechanism.
⚗️ Check Stoichiometry and Charge Sequencing
Small errors in ratio can matter greatly where an equilibrium reaction, competing reaction, or narrow catalyst window is involved. Confirm actual charged masses, concentrations, order of addition, and hold times—not merely what the batch sheet intended.
Sequence can be as important as totals. Adding a reactive reagent before adequate mixing or temperature control may create localized excess concentration, producing impurities even though the final overall ratio appears correct.
🌡️ Look for Temperature, Pressure, and Residence-Time Drift
Reaction rates, equilibria, vapor-liquid behavior, and degradation pathways are sensitive to operating conditions. A jacket control loop may display the correct temperature while the bulk contents or a poorly mixed zone experiences something different.
For continuous systems, residence-time distribution matters. Channeling, bypassing, or altered liquid holdup can allow part of the feed to leave too quickly. For batch systems, a shortened reaction hold may leave unreacted material that later appears as a recovery problem.
🔄 Investigate Mixing and Mass-Transfer Limits
Some reactions are limited not by intrinsic chemistry but by how quickly phases contact one another. Gas-liquid hydrogenation, liquid-liquid extraction, solid dissolution, and slurry reactions all depend on dispersion, interfacial area, and circulation.
Changes in agitator speed, impeller condition, liquid level, viscosity, gas sparger condition, or baffle integrity can reduce mixing. The result may be poor selectivity, incomplete reaction, or variable batch-to-batch yield.
🧲 Assess Catalyst, Enzyme, and Reagent Activity
Active materials can lose performance through poisoning, fouling, thermal damage, age, contamination, or incorrect storage. A declining catalyst may reduce conversion, but it can also alter selectivity and make downstream purification harder.
Do not infer activity solely from elapsed time. Use process indicators and, where appropriate, controlled testing of retained samples. Any test plan should account for safe handling, representative conditions, and the possibility that another variable changed at the same time.
🧯 Trace Side Reactions and Product Degradation
Desired product may be made and then destroyed. Heat exposure, oxygen ingress, light, acidic or basic conditions, metal contamination, and excessive residence time can drive degradation.
Analytical profiles are especially useful here. Rising concentrations of specific impurity families can connect a yield loss to a plausible pathway. A total-mass balance may close while product yield falls because material has simply changed identity.
🧫 Find Product Left in Mother Liquor
Crystallization and filtration often hide a large portion of lost product in the liquid phase. Solubility changes with temperature, solvent composition, impurity level, and cooling profile, so a small operating change can leave more product dissolved.
Measure product concentration in mother liquor and compare it with an appropriate baseline. Avoid assuming that colder is always better: very rapid or deep cooling can create fine crystals that are difficult to filter, wash, or retain.
💧 Inspect Washes, Extractions, and Phase Splits
Washing removes impurities but can dissolve or entrain valuable product. In extraction, the product may partition into the wrong phase because of pH, solvent ratio, temperature, emulsions, or insufficient settling time.
A simple stream assay can be revealing: analyze both phases and the interface material, not just the intended product phase. If an emulsion layer is discarded, its composition may explain a recurring loss that ordinary flow records cannot.
🧺 Examine Filtration, Centrifugation, and Solids Handling
Solid-liquid separation can lose product through cake breakthrough, fines passing through media, poor displacement washing, or solids retained in equipment. Filter cloth damage and changed particle-size distribution deserve the same attention as pump performance.
Look at wet-cake mass, filtrate turbidity, solids assay, and wash volumes together. A heavier cake may appear favorable until assay shows it carries excess mother liquor containing impurities or dissolved product.
♨️ Follow Losses Through Drying and Thermal Processing
Drying can create losses through dust entrainment, deposits, sublimation or volatilization of susceptible compounds, and thermal decomposition. Product recovered in dust collectors or condensers is not necessarily waste, but it must be included in the balance.
Monitor exhaust conditions, cyclone or bag-filter performance, condenser collection, and product assay before and after drying. The correct response may be changed drying conditions, better collection, or revised handling—not simply increasing batch size.
🚰 Account for Vents, Drains, and Waste Streams
Routine losses are often hidden in streams treated as operational housekeeping: reactor vents, vacuum-system condensate, line flushes, floor washings, off-spec dumps, wastewater, and maintenance drains.
These streams may be intermittent, making them easy to miss in daily reporting. Traceability improves when each disposal or recovery stream has a defined destination, estimated volume or mass, and a documented composition when material value or environmental risk justifies measurement.
🛢️ Look for Holdup, Heel, and Transfer Losses
Every vessel, hose, filter, pump casing, and pipeline can retain material. This holdup may be harmless in a steady continuous process, but it can significantly affect batch yield, grade changeovers, and small campaigns.
A vessel heel is the material deliberately or unintentionally left behind after discharge. Changes in viscosity, valve position, drain geometry, or operator technique can increase it. A practical test is to compare expected residual inventory with actual recovery during a controlled cleaning or flush.
🔁 Treat Recycle and Purge Streams Carefully
Recycle can improve raw-material utilization, but it complicates yield accounting. A component may appear multiple times inside the process before leaving as product, purge, or waste.
Use fresh-feed basis for overall performance and identify the purge explicitly. If impurities accumulate in recycle, a reduced purge can temporarily look attractive because less material is discarded, while eventually lowering quality or selectivity.
📦 Include Off-Spec Product and Rework
Material that meets mass targets but fails purity, color, particle-size, moisture, or other specifications may be economically unavailable as product. Whether it counts as yield loss depends on the stated boundary and whether it is successfully reworked.
Keep first-pass yield, final saleable yield, and rework recovery distinct. Combining them can conceal a process that technically recovers mass but consumes excessive time, utilities, capacity, and labor to do so.
🧠 Use Trends to Locate the First Change
Plot yield alongside meaningful process variables: feed assay, reactor temperature profile, pH, agitation load, pressure, filtration time, solvent composition, and impurity levels. The aim is not to prove causation from a chart alone, but to identify changes that occurred before the yield shift.
Time alignment matters. A feed change may affect the next batch, while fouling may emerge gradually. Event logs for maintenance, instrument calibration, supplier changes, and procedure revisions often provide vital context.
🧩 Test Hypotheses With Targeted Experiments
Once likely loss mechanisms are identified, design tests that can distinguish them. Change one meaningful factor at a time when feasible, or use a structured experimental plan when interactions are expected.
For example, if dissolved product in mother liquor is suspected, compare representative liquors at controlled temperatures and solvent compositions. If mixing is suspected, verify mechanical condition and evaluate a safe operating range rather than making several uncontrolled changes at once.
🛠️ Prioritize Fixes by Impact, Confidence, and Risk
Not every observed loss deserves the same response. Rank corrective actions by estimated recoverable material, confidence in the mechanism, implementation effort, impact on safety and quality, and risk of unintended consequences.
| Finding | Potential response | Key caution |
|---|---|---|
| Product in filtrate | Adjust crystallization or improve solids capture | Check impurity rejection and filterability |
| High transfer holdup | Improve drainability or recovery flush | Control dilution and cross-contamination |
| Side-product increase | Adjust reaction conditions or feed quality | Confirm root cause before narrowing limits |
| Instrument discrepancy | Calibrate or replace measurement device | Do not assume the physical process changed |
🦺 Protect Safety While Chasing Yield
A yield improvement is not successful if it increases runaway risk, overpressure potential, worker exposure, emissions, or product hazards. Faster heating, reduced purge, higher solvent loading, and more aggressive recovery steps may each introduce new risks.
Apply the site’s management-of-change and process-safety practices before implementing modifications. Include operators, maintenance personnel, quality staff, and environmental specialists early; they often recognize practical constraints that are invisible in a spreadsheet.
📋 Standardize the Successful Operating Window
After a fix works, convert the learning into controlled practice. Update operating instructions, setpoints, sampling plans, equipment checks, training materials, and alarm or trend review where appropriate.
A useful operating window states more than a target value. It defines which conditions matter, acceptable ranges, response actions, and the evidence that indicates drift. This makes the improvement repeatable across shifts and campaigns.
📈 Monitor Leading Indicators, Not Only Final Yield
Final yield is a lagging result: by the time it is known, the batch or campaign is often complete. Leading indicators reveal developing loss mechanisms earlier.
- Feed active-content assay and moisture
- Reaction impurity profile or endpoint measurement
- Filtrate product concentration
- Filter differential pressure and turbidity
- Transfer residuals and recovered flush volume
- Dryer exhaust loading or collector recovery
The best indicators are specific to the established failure mode and practical enough to review consistently.
🚫 Avoid Common Yield-Investigation Traps
One common mistake is treating the largest visible unit as the most likely cause. Another is changing several operating conditions at once, which may improve results but destroys the ability to learn why.
Teams also sometimes chase tiny balance gaps while ignoring off-spec material or repeated losses in a known side stream. A disciplined investigation follows mass, composition, timing, and uncertainty rather than organizational assumptions.
🤝 Make Yield Work a Cross-Functional Practice
Operations knows how the plant behaves in real time. Laboratory teams understand analytical limitations. Process engineers connect mechanisms and balances; maintenance teams identify mechanical degradation; quality and supply teams see specification and feed changes.
Bring these perspectives into a short, shared review of the loss map and evidence. A yield problem rarely respects departmental boundaries, and the fastest credible answer is usually built from several kinds of expertise.
🧭 The Core Principle: Account for Every Plausible Destination
Poor yield is not a mystery to be solved by intuition alone. It is a structured accounting problem supported by chemical understanding. First define the metric and boundary; then validate measurements, close the balance as far as practical, and trace material through reaction, separation, handling, recycle, and quality disposition.
The strongest investigations distinguish a true physical loss from a reporting artifact, distinguish formation losses from recovery losses, and test corrective actions without compromising safety. That approach turns a disappointing number into a specific, manageable engineering problem.
Engineers fix poor process yield by following the material with clear boundaries, reliable measurements, and a willingness to investigate every credible path it can take. 🧪⚖️🏭