
A heat exchanger may look unchanged from the outside while quietly consuming more steam, more fuel, or more electrical power every day. Product temperatures begin to drift, cooling water flow is increased, and operators make small adjustments to keep the process on target.
In many plants, the underlying problem is not a failed pump or a faulty controller. It is material accumulating where heat must cross from one fluid to another: on tubes, plates, channel walls, or finned surfaces.
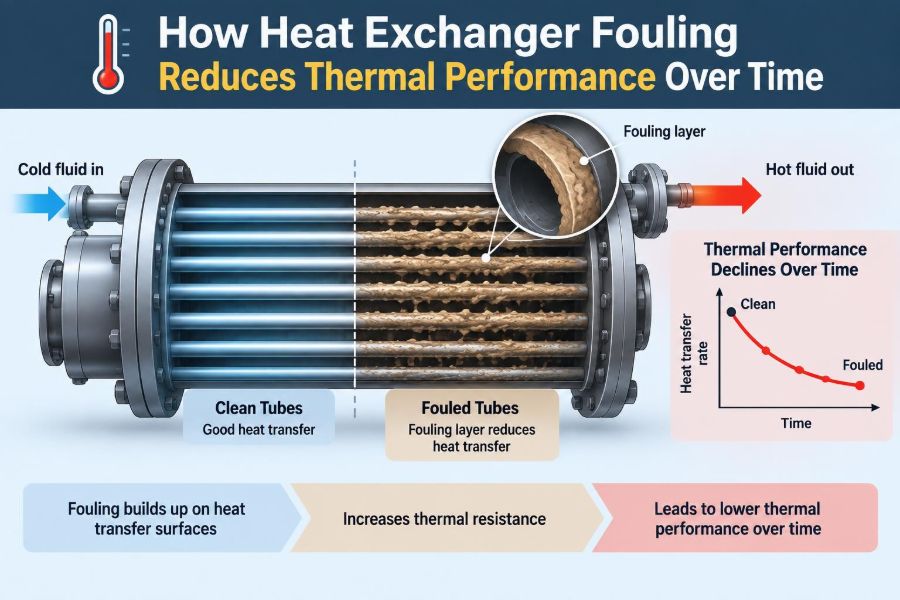
This buildup is called fouling. It can be a thin mineral scale, biological film, corrosion product, polymer deposit, oil residue, coke, or simply trapped solids. Its chemistry and appearance vary widely, but its thermal consequence is remarkably consistent.
Fouling adds resistance to heat flow and often changes fluid flow at the same time. Understanding both effects helps engineers recognize declining performance early, select practical cleaning methods, and avoid treating a predictable degradation mechanism as a mystery.
🔄 What a Heat Exchanger Is Meant to Do
A heat exchanger transfers thermal energy between fluids at different temperatures without normally allowing them to mix. A shell-and-tube exchanger might cool hot process liquid with cooling water, while a plate exchanger might recover heat from a warm outlet stream to preheat a cold feed.
The driving force is the temperature difference between the fluids. Heat passes from the hot fluid, through its boundary layer and the exchanger wall, then through the boundary layer of the colder fluid.
When each of these steps remains efficient, a relatively compact area can transfer a large amount of heat. Fouling interferes with that path.
🧱 Fouling Is an Added Thermal Barrier
Think of a clean metal tube wall as a thin metal spoon in hot tea: metal conducts heat readily. Now coat the spoon with a layer of wax or dried residue. Heat can still pass, but it does so less easily.
In exchanger calculations, fouling is represented by a fouling resistance, often written as Rf. It is not a universal material constant because its value depends on deposit thickness, structure, moisture, composition, and contact with the wall.
A porous deposit may contain liquid and transfer some heat. A dense crystalline scale or carbonaceous layer is usually a much stronger barrier. Either way, the clean surface no longer behaves as designed.
📉 The Overall Heat-Transfer Coefficient Falls
Engineers often summarize exchanger performance with the overall heat-transfer coefficient, U. In simplified form, heat duty is expressed as Q = UAΔTlm, where A is heat-transfer area and ΔTlm is the log-mean temperature difference.
As deposits build, the total resistance increases, so U decreases. If area and available temperature driving force stay unchanged, the exchanger transfers less heat.
This explains a common operating observation: two streams enter at familiar temperatures and flows, yet the hot stream leaves hotter than expected or the cold stream leaves cooler than required. The exchanger has lost thermal conductance.
🧮 Heat Transfer Has Several Resistances in Series
Fouling matters because heat transfer is already a chain of resistances. The fluid films adjacent to the wall, the wall itself, and any coatings all contribute.
A useful conceptual expression is:
1/U = 1/h_hot + R_f,hot + R_wall + R_f,cold + 1/h_cold
Here, h represents convective heat-transfer coefficients on the hot and cold sides. The exact equation may include area corrections for cylindrical tubes, but the message remains: a new fouling resistance raises 1/U and lowers U.
In a clean exchanger with strong turbulence, fluid-film resistance may be small. Then even a modest deposit can account for a substantial portion of the total resistance.
🌡️ Why the Temperature Profile Changes
Fouling does not merely reduce a single performance number. It reshapes the temperature profile through the exchanger. The fluid receiving heat may not reach its intended outlet temperature, while the stream being cooled may retain excess heat.
In countercurrent service, a clean exchanger can often achieve a close approach between one outlet temperature and the opposite inlet temperature. As fouling worsens, that approach typically becomes larger because the available area is no longer used effectively.
Control systems may conceal this early decline by increasing utility flow or changing a bypass. Those corrections preserve a process temperature temporarily, but they also make the underlying deterioration less visible.
🧊 The Cold-Side and Hot-Side Deposits Are Not Equivalent
A deposit on either side creates thermal resistance, but its operational consequences can differ. A cooling-water scale on the cold side often raises the metal-wall temperature needed to remove the same heat from the process.
A process-side organic or polymeric deposit may also narrow flow passages and directly affect product handling. In condensing or boiling services, deposits can disrupt phase-change heat transfer, which may be especially consequential.
Identifying the fouled side matters for diagnosis. A reduced U value alone indicates degraded thermal performance, not the deposit location or chemistry.
🪨 Scaling: Mineral Deposits from Dissolved Salts
Scaling occurs when dissolved salts become less soluble and precipitate onto heat-transfer surfaces. Calcium-containing deposits are familiar examples in water systems, but many industrial brines and process fluids can form other mineral scales.
Heating can promote scale because solubility behavior changes with temperature and because evaporation or concentration near the wall can make the local liquid more saturated than the bulk stream.
Scale is often hard, adherent, and relatively insulating. It may form unevenly, especially in hot zones, low-velocity regions, or locations where boiling and concentration occur.
🦠 Biofouling: Living Films in Water Systems
Biofouling develops when microorganisms attach to wetted surfaces and form a biofilm: a matrix of cells and extracellular material. Cooling-water systems are particularly susceptible when conditions support microbial growth.
Biofilms are not just soft biological layers. They can trap suspended solids, retain nutrients, alter local chemistry, and create a foundation for more complex deposits.
The thermal penalty may develop gradually, while the roughened surface and restricted passages raise pressure drop. Effective control usually requires water-treatment management and monitoring, not just an occasional mechanical clean.
⚙️ Particulate Fouling and Sedimentation
Particles such as silt, corrosion debris, catalyst fines, fibers, or process solids can settle or become trapped on exchanger surfaces. Low velocity, poor distribution, dead zones, and damaged strainers make deposition more likely.
Unlike a uniform scale, particulate deposits can be highly localized. A blocked section may receive little flow and contribute almost no heat transfer, even while the overall exchanger appears to be operating.
Filtration, side-stream treatment, inlet strainers, and maintaining suitable velocity can reduce this form of fouling. These measures must be matched to particle size and fluid compatibility rather than applied generically.
🧪 Chemical-Reaction Fouling and Polymer Formation
Some deposits are created by reactions at or near the hot surface. Polymerization, degradation, oxidation, and condensation reactions can generate sticky films or hard solids from process components.
This category is common in services involving reactive organics, monomers, heavy hydrocarbons, food products, and thermally sensitive fluids. Surface temperature may matter more than bulk fluid temperature because the wall can be significantly hotter than the flowing stream.
Reducing residence time in hot stagnant regions, controlling oxygen exposure where relevant, and avoiding excessive wall temperatures can be more effective than simply increasing cleaning frequency.
🔥 Coking in High-Temperature Hydrocarbon Service
Coking refers to carbon-rich deposits that form when hydrocarbons undergo severe thermal degradation or related reactions at hot surfaces. It is associated with fired heaters and some high-temperature exchanger duties, although the mechanisms depend strongly on feed composition and operating conditions.
Coke reduces heat transfer and can create a feedback loop. As the deposit thickens, operators may raise the hot-side temperature to maintain duty, increasing wall temperature and potentially accelerating further deposition.
Because this service can involve high temperatures and combustible materials, mitigation and decoking plans require process-specific engineering and careful safety controls.
🛡️ Corrosion Fouling Creates Rough, Unstable Deposits
Corrosion products can accumulate on a heat-transfer surface or arrive from upstream equipment. Iron oxides, for example, may settle in low-velocity regions and combine with other deposits.
Corrosion and fouling often reinforce each other. Deposits can create differential aeration cells, concentrate corrosive species, or shield areas from inhibitors; corrosion roughness can then provide more sites for deposition.
For this reason, cleaning without investigating metallurgy, water chemistry, oxygen ingress, and inhibitor performance may lead to a short-lived improvement.
💨 Freezing and Solidification Can Mimic Fouling
Not every thermal resistance is a conventional deposit. Wax, ice, crystallized product, or solidified process material can accumulate when local wall temperature crosses a phase-change boundary.
These cases may develop rapidly after a utility-temperature change, reduced flow, altered composition, or start-up upset. The remedy may involve restoring temperature control or flow conditions rather than applying a standard descaling chemical.
Distinguishing solidification from scale is essential before cleaning, since the wrong method can be ineffective or damage equipment.
🚧 Pressure Drop Often Rises Alongside Thermal Loss
Deposits reduce open flow area and increase surface roughness. Both effects increase frictional resistance, so the pressure drop across the exchanger often rises as fouling progresses.
Pressure drop is therefore a valuable companion indicator to thermal data. However, its interpretation needs care: a decrease in flow from a pump problem can lower pressure drop while also reducing heat transfer.
A pattern of falling U, rising pressure drop, and increasing utility demand is much more informative than any one measurement alone.
🌀 Flow Velocity Has a Two-Sided Role
Higher velocity commonly increases turbulence and the convective coefficient, which improves clean heat transfer. It can also reduce settling and make it harder for loosely attached particles to remain on the surface.
But higher velocity is not an unlimited solution. It raises pumping power, may increase erosion risk, and can be constrained by vibration, allowable pressure drop, or shear-sensitive fluids.
The practical target is a velocity range appropriate to the exchanger type, fluid properties, solids content, and mechanical design—not simply the maximum possible flow.
🧭 Dead Zones and Poor Distribution Invite Deposits
Fouling is rarely uniform because real exchangers do not always distribute fluid perfectly. Low-flow lanes, recirculation pockets, stagnant channels, and maldistributed shell-side flow can become local deposition sites.
In shell-and-tube equipment, baffle arrangement, bypass streams, sealing strips, and tube layout influence distribution. In plate exchangers, channel geometry and gasket condition can affect whether each passage receives the intended flow.
A recurring deposit in the same location is a clue that hydraulics or geometry, not just fluid quality, deserves attention.
📊 How Engineers Detect Declining Thermal Performance
The most useful monitoring begins with reliable temperatures, flow rates, and pressure measurements. From these, an engineer can estimate heat duty from each stream and compare calculated performance with a clean baseline or expected operating model.
Useful trends include:
- hot- and cold-stream inlet and outlet temperatures,
- utility consumption or utility control-valve position,
- flow rates on both sides,
- pressure drop across each circuit,
- estimated U, heat duty, or approach temperature.
Instrumentation uncertainty matters. A small apparent change may be sensor drift, a changed fluid property, or an unmeasured bypass rather than genuine fouling.
📈 The Fouling Curve Is a Decision Tool
A fouling curve plots a performance indicator, often fouling resistance or U, against operating time. Some exchangers foul rapidly at first and then approach a plateau; others show a long induction period followed by faster decline.
The shape can reveal mechanism changes. For example, a sudden step change may follow contamination, loss of treatment chemical, an operating upset, or a flow redistribution event.
Trend data is most valuable when operating context is recorded alongside it. A curve without notes on throughput, composition, cleaning dates, and utility conditions can invite misleading conclusions.
🧾 Clean Design Margin Is Not a License to Ignore Fouling
Designers often include an assumed fouling allowance when sizing an exchanger. This means added area or a reduced design U is used so the equipment can meet duty after some expected degradation.
That allowance is a design assumption, not a prediction that every service will foul at one fixed rate. Feed changes, water-treatment failures, different throughput, and altered temperatures can make actual fouling milder or much more severe.
Oversizing can extend run length, but it does not eliminate deposits, pressure-drop limits, cleaning needs, or the possibility of underperforming during abnormal conditions.
🏭 A Simple Operating Example
Consider a hypothetical cooler that must reduce a process stream to meet a downstream separation requirement. At first, the target outlet temperature is met with moderate cooling-water flow.
Over several weeks, operators progressively open the cooling-water valve. Eventually it is nearly fully open, yet the process outlet temperature still rises. If process flow and inlet temperatures are comparable to the clean case, reduced U from cooling-water scale or biofouling becomes a credible explanation.
If the water-side pressure drop has also risen, the diagnosis becomes stronger. A sample of deposit, inspection during outage, and water-chemistry review would then help determine the actual mechanism.
💸 The Cost Is Usually Larger Than Lost Duty
Lower thermal performance can increase fuel use, steam demand, refrigeration load, pumping energy, or cooling-water consumption. It can also constrain production when a downstream unit cannot receive fluid at the required temperature.
There are indirect costs as well: off-spec product risk, shortened campaign length, maintenance labor, cleaning chemicals, waste handling, and production loss during shutdown. The balance differs by service and site.
A cleaning decision should compare these operating consequences with the cost, duration, safety implications, and likely effectiveness of intervention.
⚠️ Local Hot Spots Can Create Equipment Risks
When an exchanger must deliver the same duty through a fouled surface, the temperature difference across the deposit often has to increase. This can drive wall temperatures higher in some services.
Higher wall temperature can worsen thermal degradation, accelerate certain deposits, stress materials, or move operation closer to temperature limits. Restricted passages may also create uneven flow and localized overheating.
These risks are highly equipment-specific. They should be evaluated using actual process conditions, mechanical design limits, and operating procedures rather than inferred from U alone.
🧼 Mechanical Cleaning Removes Many Physical Deposits
Mechanical methods include tube brushing, high-pressure water cleaning, rodding, scraping, and—in suitable systems—online sponge-ball cleaning. They are often effective for loose solids, soft biological deposits, and some scales.
Access matters. Straight-tube shell-and-tube exchangers are generally easier to mechanically clean than tightly packed plate passages or complex compact exchangers.
Aggressive methods can damage tubes, plates, coatings, or gaskets if poorly selected. Cleaning procedures should account for material compatibility, pressure limits, confinement, and worker exposure.
🧴 Chemical Cleaning Requires Deposit Identification
Chemical cleaning, often called clean-in-place in systems designed for circulation, can dissolve or loosen deposits without opening equipment. Acids may be used for some mineral scales; alkaline, solvent, oxidizing, enzymatic, or formulated cleaners may suit other deposits.
There is no universal chemical cleaner. A formulation that removes carbonate scale may be unsuitable for stainless steel under certain conditions, ineffective against polymer deposits, or hazardous when mixed with residual process chemicals.
Before chemical cleaning, engineers should consider deposit analysis, metallurgy, gasket and seal compatibility, inhibitor needs, waste neutralization, ventilation, and isolation requirements.
🧯 Thermal and Operational Cleaning Have Limits
Some deposits can be softened, melted, or removed by controlled changes in temperature, flow direction, or solvent flushing. Certain services use thermal cycling or steam-out procedures where equipment design and process safety allow it.
These methods can create thermal stress, release trapped material, or shift deposits downstream. They should not be treated as casual operational adjustments.
When a process is reactive, toxic, pressurized, or high temperature, cleaning plans need the same disciplined hazard review as other non-routine operations.
🧩 Prevention Starts with the Fluid, Not the Deposit
The most durable fouling strategy often begins upstream: remove solids, control water chemistry, stabilize feed composition, limit oxygen ingress, or prevent conditions that trigger precipitation and reaction.
For cooling-water service, treatment may address scale-forming tendency, corrosion, suspended solids, and microbiological growth. For process service, filtration, feed pretreatment, residence-time control, or temperature management may be more relevant.
Prevention has trade-offs. Added filtration creates maintenance demand, treatment chemicals require control, and lower wall temperatures may require more area or a different utility. The best solution fits the complete process.
🛠️ Design Choices Influence Future Cleanability
Exchanger selection should consider fouling behavior as well as initial thermal duty. A highly compact exchanger may be efficient and economical for clean fluids but difficult to recover after severe particulate fouling.
Design details that can improve maintainability include accessible channels, removable bundles, adequate isolation points, drainability, cleaning connections, appropriate velocity, and instruments placed to detect degradation.
Materials and surface finishes also matter, although no material is universally foul-proof. A material selected solely for corrosion resistance may still accumulate deposits if the operating environment favors them.
🗓️ Condition-Based Cleaning Usually Beats a Fixed Calendar
Cleaning too early wastes outage time and resources; cleaning too late can increase energy use, create production limits, and make deposits harder to remove. A condition-based trigger uses performance and operational constraints to choose timing.
Possible triggers include a minimum acceptable U, a maximum pressure drop, a utility-valve limit, an outlet-temperature limit, or evidence that wall temperature is approaching a process-specific boundary.
Calendar schedules still have a role where inspection windows are fixed or fouling behavior is well established. The strongest programs combine scheduled opportunities with actual condition data.
🚫 Common Diagnostic Mistakes
One frequent mistake is calling every loss of duty “fouling.” Reduced flow, a bypass left open, air binding, incorrect valve position, changed fluid properties, a control problem, or a shifted process load can produce similar symptoms.
Another is comparing data from unlike conditions. Heat-transfer performance must be evaluated with flow rates, temperatures, phase behavior, and fluid properties in mind.
- Do not rely on outlet temperature alone.
- Do not assume a clean exchanger is correctly instrumented.
- Do not select a cleaning chemical before considering deposit and material compatibility.
- Do not overlook upstream sources of solids or contamination.
🔍 Post-Cleaning Results Should Feed the Next Run
Cleaning is an opportunity to learn. Record the observed deposit location, thickness, texture, color, odor where safely relevant, and ease of removal. Where justified, laboratory analysis can distinguish mineral, biological, corrosion-related, and organic components.
Compare post-cleaning U and pressure drop with the previous clean baseline. If performance does not recover as expected, residual deposits, damaged internals, maldistribution, sensor problems, or a non-fouling cause may remain.
Over time, these records transform maintenance from repeated response into a site-specific fouling model.
🧠 The Core Principle: Fouling Changes Both Heat and Flow
Heat exchanger fouling is best understood as a coupled thermal and hydraulic problem. Deposits add insulation, restrict flow passages, alter turbulence, and sometimes change the chemistry at the wall.
The practical response is equally connected: monitor temperatures, flow, pressure drop, and utility demand; identify the deposit mechanism; remove deposits safely; and correct the conditions that allow them to return.
The central takeaway is simple: a heat exchanger loses performance over time because fouling adds resistance to heat transfer, and the most effective solution targets the specific mechanism rather than merely compensating with more utility.
Clean surfaces restore more than a favorable U value—they restore operating margin, controllability, and confidence in the process. 🌡️🔧📈