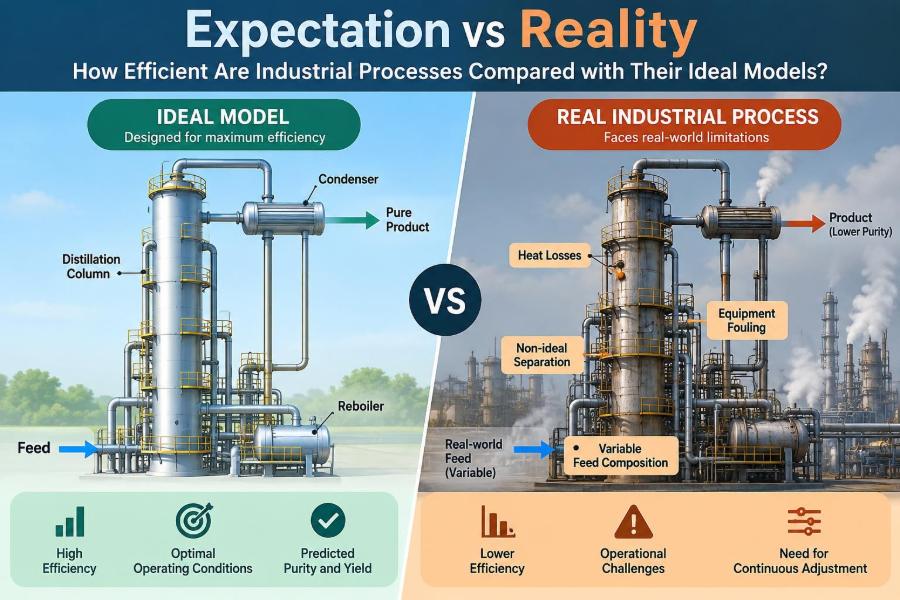

A process design can look almost effortless on paper. Feed enters, heat is added or removed exactly where needed, a separator delivers a clean product, and the mass and energy balances close neatly.
Then the plant starts. A pump draws slightly more power than expected. A heat exchanger gradually fouls. Feed composition drifts across the week. A control valve spends its life partly open because the system has to handle more than one operating case.
None of this means the model was useless. Ideal models give engineers a reference point: a way to understand limits, compare options, and identify where losses originate. The difficulty begins when an ideal result is mistaken for a guaranteed plant result.
Industrial efficiency is therefore not one number and not one disappointment. It is the gap between a carefully defined theoretical benchmark and a real process operating safely, reliably, economically, and within environmental constraints.
🔍 What “efficiency” actually means in a process plant
Efficiency describes how effectively a process converts inputs into a desired output. But the desired output may be useful energy, product mass, chemical value, separation purity, production time, or revenue.
A furnace can have high thermal efficiency while the overall plant has poor energy efficiency. A reactor can give high conversion while producing too much unwanted by-product. Before comparing ideal and real performance, engineers must state which efficiency is being measured and where the boundary lies.
📐 Why ideal models are deliberately unrealistic
Ideal models simplify reality so that the dominant physics or chemistry becomes visible. They may assume perfect mixing, no friction, reversible heat transfer, pure feeds, instantaneous equilibrium, or steady operation.
These assumptions are not claims about a real plant. They create an upper limit or a baseline. For example, a reversible compressor defines the least possible compression work for specified inlet and outlet states, even though no practical compressor is reversible.
🧭 The first rule: compare like with like
A meaningful efficiency comparison uses identical system boundaries, feed conditions, product specifications, and time basis. Comparing a real unit over a month with an ideal calculation for a single clean-feed moment can make the gap look larger or smaller than it really is.
Engineers also distinguish between design, test, and operating conditions. A turbine may perform close to its design point during a controlled test but less efficiently during normal operation because plant demand changes.
⚖️ Mass balance comes before performance claims
The mass balance asks a basic question: where did every material stream go? For a nonreacting process, material entering must leave or accumulate. In reacting systems, elements are conserved even when molecules change.
Unexpected balance gaps often reveal practical losses: leaks, evaporation, sampling errors, unmeasured purge streams, entrained liquid, or inaccurate flow meters. An efficiency calculation built on weak material accounting can be misleading even if its equation is correct.
🔥 Energy balance reveals where useful work disappears
Energy enters a plant through fuel, steam, electricity, hot feeds, and chemical enthalpy. It leaves in products, stack gases, cooling water, radiation, shaft work, and other streams.
An energy balance does not automatically call every loss avoidable. Cooling may be required to condense a product, protect equipment, or remove reaction heat. Still, the balance shows where to investigate: a hot stack, excessive cooling duty, hot uninsulated piping, or a high-pressure stream being throttled.
🌡️ The second law sets a stricter benchmark
The first law tracks the quantity of energy; the second law tracks its quality. A megajoule of high-pressure steam can do more useful work than a megajoule of warm cooling water.
This is why exergy, sometimes called available work, is valuable in process analysis. Exergy is destroyed by irreversibilities such as friction, uncontrolled mixing, combustion, finite-temperature heat transfer, and chemical reaction away from equilibrium. A process can conserve energy while wasting much of its ability to do useful work.
🌀 Friction and pressure drop are everyday penalties
Real fluids experience friction in pipes, fittings, valves, heat exchangers, packed beds, and filters. The resulting pressure drop must be overcome by pumps, compressors, or upstream pressure.
The penalty is not always just electrical power. In distillation, excess column pressure can raise boiling temperatures and alter relative volatility, making a separation harder. Designers therefore balance small equipment and low capital cost against larger flow passages that reduce pressure loss.
💨 Why compression is never perfectly efficient
Ideal compression is often modeled as isentropic, meaning reversible and adiabatic. Real compressors generate entropy through internal friction, leakage, turbulence, and nonideal flow patterns.
Isentropic efficiency compares actual work with ideal work for the same pressure rise. It helps diagnose deterioration, but it does not describe the whole compression system. Aftercoolers, suction losses, recycle flow, anti-surge control, and driver efficiency all affect the electricity ultimately consumed.
🌊 Pumps have a best efficiency point, not a magic setting
Centrifugal pumps are most efficient near their best efficiency point, or BEP. Away from that region, recirculation, vibration, hydraulic losses, and internal flow separation increase.
A pump may run far from BEP because a throttling valve controls flow, demand has changed, or the original design included a large safety margin. In suitable applications, changing impeller diameter or using variable-speed control can reduce throttling losses, though the operating range and reliability must be checked.
♨️ Heat transfer needs a driving force
An ideal heat exchanger might transfer heat with an infinitesimal temperature difference. In reality, heat must move across metal surfaces, boundary layers, and often deposits, so a finite temperature difference is necessary.
That difference creates entropy generation. A very small approach temperature can recover more heat but needs a larger and more expensive exchanger. The efficient choice is rarely “maximize heat recovery at any cost”; it is a practical trade-off among energy, capital, control, and operability.
🧱 Fouling slowly changes the process
Fouling is the buildup of scale, corrosion products, biological material, coke, or deposited solids on heat-transfer surfaces. It increases thermal resistance and can also raise pressure drop.
Its effects often appear gradually: steam use rises, product temperatures drift, or a control valve moves closer to its limit. A design fouling allowance anticipates some degradation, but maintenance planning and feed treatment determine whether actual performance remains acceptable between cleanings.
🧪 Chemical equilibrium is a destination, not a travel time
Equilibrium calculations predict the final composition a reversible reaction would approach under specified conditions. They do not say how quickly the mixture gets there.
Reaction kinetics determines rate. A reaction with a favorable equilibrium may still need a catalyst, higher temperature, longer residence time, or better mixing. Conversely, pushing temperature upward may improve rate while worsening equilibrium yield for an exothermic reversible reaction.
⏱️ Residence-time distribution complicates reactor ideals
Textbook reactors are often modeled as either plug-flow reactors, with no axial mixing, or continuously stirred tanks, with complete mixing. Industrial vessels fall somewhere between those ideal patterns.
Some fluid may bypass a catalyst bed, some may recirculate in stagnant zones, and some may leave earlier than the nominal residence time suggests. Residence-time distribution testing helps characterize these deviations and can explain conversion shortfalls that simple volume calculations miss.
🧬 Selectivity can matter more than conversion
Conversion is the fraction of a reactant consumed. Selectivity is the fraction of consumed reactant that becomes the desired product rather than by-products. Yield combines both ideas.
A high-temperature reactor may raise conversion but accelerate undesired reactions, increasing purification load and reducing valuable product yield. The best operating condition is often not the one with the highest single-pass conversion; it is the one that gives the best safe and economical overall outcome.
🧂 Separation is often where energy demand concentrates
Many chemical processes create mixtures, while customers need purified products. Separating similar components can consume substantial energy, particularly when distillation must repeatedly vaporize and condense material.
Ideal-stage methods estimate the separation duty under stated assumptions. Real columns require more trays or packing height because tray efficiencies are below 100%, vapor and liquid do not contact perfectly, and hydraulics impose limits.
🏗️ Real distillation columns face hydraulic limits
At high vapor rates, a column can flood: liquid is carried upward, pressure drop rises, and separation deteriorates. At very low rates, weeping can occur as liquid leaks through tray openings instead of flowing across trays properly.
Foaming, entrainment, maldistribution, damaged internals, and feed changes can all move a column away from its intended behavior. This is why a simulation result must be paired with hydraulic design and plant observations, not treated as a complete answer.
💧 Membranes and filters trade purity for driving force
Membrane separations can avoid phase changes and may use less energy than thermal methods in the right service. Yet flux declines as concentration polarization, fouling, or compaction develops, and cleaning can interrupt production.
Filters similarly become less permeable as cake accumulates. Higher pressure may restore flow temporarily, but it can compact the cake or force fine particles through. Real efficiency includes cleaning frequency, reject handling, membrane life, and product recovery.
🔄 Recycle streams improve recovery but add complexity
Recycling unreacted material can improve overall conversion and reduce raw-material loss. It also increases circulation rates, equipment size, compression duty, and the number of interactions among units.
Impurities that enter with fresh feed may build up in a recycle loop. Plants use purge streams to prevent this accumulation, accepting some loss of valuable material. The optimum purge is a balance, not a rule to minimize blindly.
🧯 Safety margins are not evidence of poor engineering
Ideal models tend to seek a narrow optimum. Industrial facilities must tolerate disturbances, uncertain feed properties, startup and shutdown, equipment aging, and abnormal events.
Extra pumping capacity, conservative relief design, spare equipment, lower reactor severity, or additional cooling may reduce a simple efficiency metric. But these provisions can protect people, equipment, product quality, and continuity of operation. A safe operating margin has value even when it consumes energy or capital.
🎛️ Control loops use energy to maintain stability
Automatic control keeps temperatures, pressures, levels, and compositions near targets despite disturbances. A valve that throttles flow wastes pressure, but it may be the most robust way to stabilize a process.
Poorly tuned control can create oscillations, unnecessary steam use, off-spec product, and frequent cycling. Better instrumentation, tuned loops, and coordinated control can recover performance without changing core equipment. However, aggressive tuning can make a loop unstable, so improvements require testing and safeguards.
📉 Part-load operation changes the picture
Most equipment is designed around a target operating range, but plants do not always run there. Market demand, maintenance constraints, upstream limitations, and seasonal conditions can force part-load operation.
At reduced throughput, fixed heat losses become larger per unit of product, rotating equipment may move away from efficient regions, and separations may lose hydraulic performance. Reporting energy per tonne alongside total energy helps make these effects visible.
🌦️ Feed quality and ambient conditions are real disturbances
Water temperature, air temperature, humidity, feed composition, particle size, and contaminant levels can all shift process performance. An air-cooled exchanger, for example, has less cooling capacity during hot weather when it may be needed most.
Good designs specify an operating envelope rather than one perfect condition. Operators need to know which variables can be adjusted when the envelope is challenged and which limits—such as maximum pressure or product specification—cannot be crossed.
🔧 Equipment age turns design performance into history
Wear, corrosion, seal leakage, catalyst deactivation, insulation damage, and instrument drift gradually alter a plant. A machine can remain functional while using more energy or producing less consistent quality.
Condition monitoring turns this decline into evidence. Vibration trends, heat-transfer coefficients, pressure-drop profiles, energy intensity, and laboratory results can reveal degradation early enough for planned action rather than emergency repair.
📊 Choose performance indicators that expose trade-offs
No single key performance indicator captures a whole facility. A useful dashboard links resource use, output, quality, reliability, and emissions.
| Indicator | What it can reveal | Common limitation |
|---|---|---|
| Specific energy use | Energy per unit of product | Can shift with product mix or feed quality |
| Yield | Useful product from raw material | May hide high utility consumption |
| On-stream factor | Time available for production | Does not show product quality |
| Overall equipment effectiveness | Availability, rate, and quality losses | Needs consistent definitions and data |
| Exergy loss estimate | Locations of thermodynamic irreversibility | Requires more detailed measurements |
Metrics should be normalized and interpreted together. An apparent energy improvement achieved by making less product or relaxing purity is not necessarily a genuine process improvement.
🧮 Simulation is a decision tool, not a plant substitute
Process simulators connect thermodynamics, material balances, energy balances, equipment models, and recycle calculations. They are excellent for screening options, estimating utility requirements, and checking design consistency.
But every simulation depends on property methods, parameters, assumptions, and input data. A model can converge neatly while representing the wrong vapor-liquid behavior or ignoring fouling and control constraints. Validation against plant data is what turns a calculation into a credible engineering tool.
🧷 Measurement uncertainty limits apparent precision
Flow meters, temperature sensors, composition analyses, and utility meters all have uncertainty. Small errors can matter greatly when efficiency is calculated from the difference between two large quantities.
Before declaring that an improvement saved a small amount of energy, engineers should check meter calibration, sampling method, operating comparability, and normal process variation. Reconciled data—measurements adjusted within their uncertainties to satisfy balances—can provide a more reliable picture.
🛠️ A disciplined way to close the ideal-real gap
The most effective improvements begin with a defined loss, not a fashionable technology. A practical sequence is:
- Define the product, boundary, operating period, and benchmark.
- Validate mass, energy, and utility measurements.
- Rank major losses by cost, safety relevance, emissions impact, and technical feasibility.
- Identify root causes such as fouling, bypassing, off-design operation, or poor control.
- Test changes carefully, then monitor whether the benefit persists.
Low-cost actions may include repairing steam leaks, restoring insulation, cleaning exchangers, correcting excess air, or adjusting setpoints. Larger projects can include heat integration, catalyst replacement, equipment redesign, or process intensification, but should be justified over the actual operating envelope.
🚫 Common mistakes when discussing process efficiency
One mistake is treating a nameplate efficiency as a permanent plant value. Another is optimizing one unit while shifting the burden to utilities, downstream separation, or waste treatment.
- Using theoretical conversion as though it were commercial yield.
- Ignoring startup, shutdown, cleaning, and standby energy.
- Comparing periods with different feed quality or production rates.
- Assuming every heat loss is economically recoverable.
- Calling a reduction in energy use an improvement without checking quality and safety.
These errors are avoidable when calculations are paired with process context and transparent assumptions.
🌱 Efficiency and emissions are connected, but not identical
Reducing fuel and electricity use often reduces associated emissions, especially where utilities rely on carbon-intensive sources. Material yield improvements can also lower upstream extraction, transport, and waste burdens.
Still, emissions depend on the energy source and the full system boundary. Electrifying a heater changes its direct emissions profile, but its broader impact depends on how electricity is generated. Environmental decisions need life-cycle thinking as well as equipment-level efficiency data.
🤝 The best solution is usually interdisciplinary
Efficiency projects sit at the intersection of process design, operations, maintenance, automation, laboratory analysis, energy systems, and safety. Operators may recognize a recurring upset that a steady-state model cannot show. Maintenance teams may identify a valve problem that explains an energy trend.
Bringing these perspectives together prevents elegant but impractical recommendations. It also creates solutions that can be operated and maintained after the project team leaves.
🎯 The core principle: ideals guide, reality decides
Ideal models establish physical limits and clarify where performance could improve. Real plants reveal the constraints that matter: irreversibility, degradation, variable feeds, controllability, safety, economics, and human operation.
The goal is not to eliminate every gap from the ideal. Some gaps are unavoidable, and some are sensible choices. The engineering task is to distinguish unavoidable losses from correctable ones, then improve the system without sacrificing the conditions that make industrial production dependable.
Industrial efficiency is best understood as a managed balance between thermodynamic possibility and reliable real-world operation. Ideal models show the direction; careful measurement, sound judgment, and continuous learning determine how far a plant can safely travel. 🧪⚙️🌿