
Pressure drop
It is important to be able to predict the drop in pressure for the flow of the two fluid streams through a packed column. Earlier in this chapter the drop in pressure arising from the flow of a single phase through granular beds is considered and the same general form of approach is usefully adopted for the flow of two fluids through packed columns. It was noted that the expressions for flow through ring-type packings are less reliable than those for flow through beds of solid particles. For the typical absorption column there is no very accurate expression, but there are several correlations that are useful for design purposes. In the majority of cases the gas flow is turbulent and the general form of the relation between the drop in pressure −_P and the volumetric gas flowrate per unit area of column uG is shown on curve A of Figure 4.16. −_P is then proportional to u1.8 G approximately, in agreement with the curve A of Figure 4.1 at high Reynolds numbers. If, in addition to the gas flow, liquid flows down the tower, the passage of the gas is not
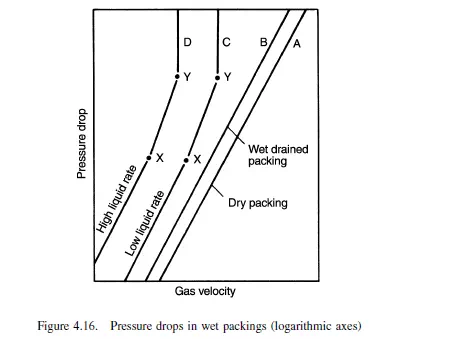
significantly affected at low liquid rates and the pressure drop line is similar to line A, although for a given value of uG the value of −_P is somewhat increased. When the
gas rate reaches a certain value, the pressure drop then rises very much more quickly and is proportional to u2.5 G , as shown by the section XY on curve C. Over this section
the liquid flow is interfering with the gas flow and the hold-up of liquid is progressively increasing. The free space in the packings is therefore being continuously taken up by the liquid, and thus the resistance to flow rises quickly. At gas flows beyond Y, −_P rises very steeply and the liquid is held up in the column. The point X is known as the
loading point, and point Y as the flooding point for the given liquid flow. If the flowrate of liquid is increased, a similar plot D is obtained in which the loading point is achieved at a lower gas rate though at a similar value of −_P. Whilst it is advantageous to have a reasonable hold-up in the column as this promotes interphase contact, it is not practicable to operate under flooding conditions, and columns are best operated over the section XY. Since this is a section with a relatively short range in gas flow, the safe practice is to design for operation at the loading point X. It is of interest to note that, if a column is flooded and then allowed to drain, the value of −_P for a given gas flow is increased over that for an entirely dry packing as shown by curve B. ROSE and YOUNG(55) correlated their experimental pressure drop data for Raschig rings by the following equation:

where: − _Pw is the pressure drop across the wet drained column. −_Pd is the pressure drop across the dry column, and dn is the nominal size of the Raschig rings in mm.
where: − _Pw is the pressure drop across the wet drained column. −_Pd is the pressure drop across the dry column, and dn is the nominal size of the Raschig rings in mm.
There are several ways of calculating the pressure drop across a packed column when gas and liquid are flowing simultaneously and the column is operating below the loading point. One approach is to calculate the pressure drop for gas flow only and then multiply this pressure drop by a factor which accounts for the effect of the liquid flow. Equation 4.19 may be used for predicting the pressure drop for the gas only, and then the pressure drop with gas and liquid flowing is obtained by using the correction factors for the liquid flow rate given by SHERWOOD and PIGFORD(56). Another approach is that of MORRIS and JACKSON(57) who arranged experimental data for
a wide range of ring and grid packings in a graphical form convenient for the calculation of the number of velocity heads N lost per unit height of packing. N is substituted in the equation:

where: − _P = pressure drop,
ρG = gas density,
uG = gas velocity, based on the empty column cross-sectional area, and
l = height of packing.
Equation 4.47 is in consistent units. For example, with ρG in kg/m3, uG in m/s, l in m, and N in m−1, −_P is then in N/m2. Empirical correlations of experimental data for pressure drop have also been presented by LEVA(58), and by ECKERT et al.(59) for Pall rings. Where the data are available, the most accurate method of obtaining the pressure drop for flow through a bed of packing is from the manufacturer’s own literature. This is usually presented as a logarithmic plot of gas rate against pressure drop, with a parameter of liquid flowrate on the graphs, as shown in Figure 4.16, although it should be stressed that all of these methods apply only to conditions at or below the loading point X on Figure 4.16. If applied to conditions above the loading point the calculated pressure drop would be too low. It is therefore necessary first to check whether the column is operating at or below the loading point, and methods of predicting loading points are now considered.


Comments are closed