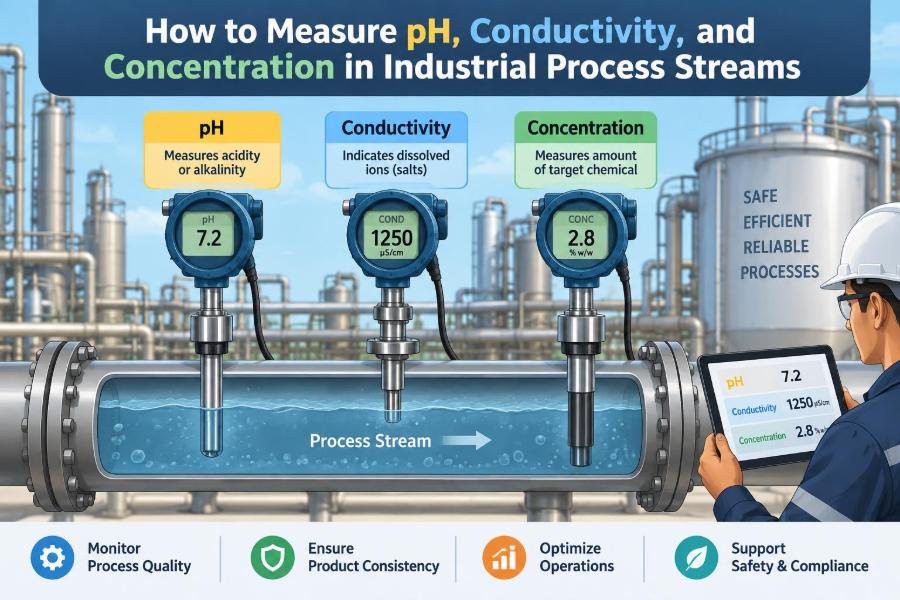

A wastewater operator sees a sudden rise in conductivity during an otherwise routine shift. In a nearby food plant, a clean-in-place return line appears to be fully rinsed—but a residual chemical concentration measurement says otherwise. At a chemical reactor, a pH change of only a few tenths may alter reaction selectivity, product quality, or corrosion risk.
These situations look different, but they share a practical question: what is actually in the process stream right now? Reliable answers depend on measuring properties that are often treated as simple numbers—pH, conductivity, and concentration—while recognizing what each number can and cannot mean.
Industrial streams are rarely as clean as laboratory samples. They can be hot, pressurized, dirty, aerated, viscous, multiphase, or chemically reactive. A measurement system must therefore do more than produce a reading; it must provide a representative, stable, and actionable value.
This guide explains the principles behind the three measurements, the instruments used, and the operating practices that turn a sensor signal into a sound process decision.
🎯 Start with the process decision
Before choosing an analyzer, define the decision it supports. Is the goal to control acid addition, detect a rinse endpoint, protect a boiler, verify product formulation, or release wastewater? The required accuracy, response time, and maintenance effort follow from that decision.
A measurement for trend monitoring may tolerate modest bias if it is repeatable. A measurement used for product specification, chemical dosing, or regulatory reporting usually needs tighter traceability, documented calibration, and confirmatory sampling.
🧭 Separate pH, conductivity, and concentration
These quantities are related only in certain systems. pH describes hydrogen-ion activity and therefore acid-base behavior. Conductivity describes a liquid’s ability to carry electric current through mobile ions. Concentration describes how much of a component is present, expressed as mass fraction, molarity, volume fraction, or another defined basis.
One cannot safely substitute for another without knowing the chemistry. A concentrated weak acid may have a different pH response than a strong acid, while a nonionic dissolved material such as sugar can significantly change concentration with little effect on conductivity.
⚗️ Understand why pH is logarithmic
In simplified form, pH is the negative logarithm of hydrogen-ion activity. The logarithmic scale means a one-unit pH shift corresponds to a tenfold change in hydrogen-ion activity under idealized conditions.
This is why pH 6 is not merely “a little more acidic” than pH 7. It also explains why pH control can become sensitive near a target value: small dosing changes may produce large apparent changes when buffering is weak.
🔬 Recognize activity versus concentration
pH electrodes respond to activity, not directly to hydrogen-ion concentration. Activity accounts for chemical interactions that become significant in concentrated solutions. In dilute aqueous streams, the distinction is often small enough for ordinary operation; in strong acids, brines, and concentrated caustic solutions, it may not be.
This limitation is not an instrument defect. It is part of the definition of pH. When a process requires composition in a concentrated electrolyte, density, titration, refractive index, or a validated conductivity correlation may be more useful than pH alone.
🔋 How a glass pH electrode works
A conventional pH sensor contains a thin, pH-sensitive glass membrane and a reference system. Hydrogen ions interact with the hydrated outer surface of the glass, producing a voltage difference that the transmitter converts to pH.
The reference electrode completes the electrical circuit through a junction in contact with the sample. Both the glass surface and the reference junction must remain functional. A perfect-looking transmitter cannot compensate for a coated bulb, blocked junction, damaged cable, or depleted reference electrolyte.
🌡️ Account for temperature in pH measurement
Temperature changes the electrode slope and can change the actual chemistry of the solution. Most industrial pH transmitters apply automatic temperature compensation to correct the electrode’s theoretical voltage response, using a built-in or adjacent temperature sensor.
That correction does not automatically convert the measured pH to what it would have been at another temperature. The process pH itself can genuinely vary with temperature, especially in buffered systems. Specify whether operations need the pH at process temperature or a laboratory value measured after cooling.
🧪 Choose buffers that match the job
Calibration establishes the relationship between electrode voltage and known buffer values. A two-point calibration commonly uses buffers that bracket the expected operating range, such as one near neutral and one on the acidic or alkaline side.
Use fresh, uncontaminated buffers at a known temperature. Do not pour used buffer back into its container, and do not calibrate in a beaker that has been used for process samples without proper cleaning. Buffer contamination is a quiet source of persistent calibration error.
🧼 Control pH sensor fouling
Oils, proteins, scale, fibers, polymer films, and biological growth can isolate the glass membrane from the process. Reference junction fouling is equally troublesome because it creates unstable or slowly drifting readings.
Cleaning must fit the deposit and sensor manufacturer’s guidance. Water may remove loose solids, while a suitable detergent, mild acid, or enzyme cleaner may be needed for other films. Aggressive cleaning can damage some sensors or shorten their service life, so “stronger” is not automatically better.
🛠️ Design a pH installation for serviceability
Install the sensor where the liquid is well mixed, representative, and continuously wet. Avoid stagnant pockets, dead legs, gas accumulation points, and locations downstream of chemical injection where mixing is incomplete.
Retractable assemblies, flow cells, and protective guards can make maintenance safer and reduce downtime. In abrasive slurries or fast-flowing lines, placement must also protect the glass bulb from mechanical damage without creating a nonrepresentative sample zone.
⚡ Define electrical conductivity
Conductivity is the ability of a solution to conduct electrical current. Dissolved ions such as sodium, chloride, hydrogen, hydroxide, calcium, and sulfate contribute to this property. Pure water has very low conductivity; dissolved salts, acids, and bases generally raise it.
Conductivity is normally reported in microsiemens per centimeter or millisiemens per centimeter. Its inverse is resistivity, often used when discussing high-purity water. The two describe the same electrical behavior from opposite directions.
📏 Learn the role of cell constant
A contacting conductivity sensor measures conductance between electrodes. To convert that electrical measurement into conductivity, the instrument uses a cell constant, determined by electrode geometry and verified through calibration.
A low cell constant suits low-conductivity water because it provides useful sensitivity. A higher cell constant is often better for conductive process liquids. Choosing the wrong range can make the reading noisy at one extreme or difficult to resolve at the other.
🔄 Compare contacting and inductive sensors
| Sensor type | Useful applications | Main limitations |
|---|---|---|
| Contacting electrode | Low to moderate conductivity, purified water, many general aqueous streams | Electrode polarization, coating, and corrosion can affect performance |
| Inductive or toroidal | High-conductivity, dirty, corrosive, or scaling liquids | Less suitable for very low conductivity; installation geometry matters |
Inductive sensors use coupled coils rather than exposed measuring electrodes. The process liquid forms part of the electrical path, reducing direct electrode contact problems. They are common in caustic, acid, brine, and difficult wastewater duties.
🌡️ Treat conductivity temperature compensation carefully
Most ionic solutions become more conductive as temperature rises because ions move more easily. A transmitter can report the actual conductivity at process temperature or calculate a temperature-compensated value referenced to a chosen temperature.
The compensation factor is solution-specific. A generic factor can be practical for approximate monitoring, but it may introduce error when composition changes or the liquid is concentrated. For critical control, validate the compensation method against the real process solution.
🧂 Know when conductivity tracks concentration
For a single, well-defined electrolyte over a limited temperature and concentration range, conductivity can be correlated with concentration. This makes it useful for monitoring caustic strength, acid dilution, salt brine, and chemical rinse carryover.
The relationship is not always linear. At higher concentrations, ion interactions and viscosity effects can flatten or reverse the response. A correlation developed in clean laboratory solution may also fail when the process contains multiple salts or contaminants.
📈 Build a defensible conductivity correlation
Collect representative samples across the intended operating range. Measure conductivity at controlled or recorded temperature, then determine concentration using an independent reference method such as titration, density, or laboratory assay.
Fit the simplest model that represents the data adequately, then test it on separate samples. Record the valid composition range, temperature basis, sensor type, and known interferents. A process correlation is an empirical model, not a universal chemical law.
🧪 Understand direct methods for concentration
Concentration can be measured directly only when the method responds selectively enough to the target component. In routine process work, “direct” usually means an instrument signal has been calibrated against composition rather than that the instrument somehow counts molecules.
Common options include titration for acids, bases, or specific ions; density for many binary liquid mixtures; refractive index for dissolved solids or compatible liquid mixtures; and spectroscopic methods where a component has a useful optical signature.
⚖️ Use density when composition changes mass per volume
Density measurement is attractive because inline vibrating-tube meters can provide rapid, continuous readings. It is widely useful when a process is dominated by a known binary mixture, such as a solvent-water blend or a specified reagent solution.
Density is not selective. Temperature, entrained gas, pressure effects, dissolved solids, and an unexpected third component can all distort a concentration estimate. For example, a density meter cannot tell whether a density increase came from the desired solute or from contamination unless the process chemistry is constrained.
🔍 Use refractive index with compatible liquids
Refractive index measures how light bends as it passes through a material. Inline refractometers are valuable in food, pharmaceutical, chemical, and crystallization duties where dissolved solids or a known component change refractive index predictably.
Bubbles, crystals, coating, color, and multiple changing components can complicate interpretation. The familiar Brix scale is useful for sucrose-based applications, but it should not be assumed to represent total solids accurately in every non-sucrose liquid.
🌈 Apply spectroscopy selectively
Ultraviolet-visible, near-infrared, Raman, and other spectroscopic techniques infer composition from interactions between electromagnetic radiation and molecules. They can be highly informative when a calibration model has been developed for a stable, well-characterized matrix.
They also require disciplined validation. Optical windows can foul, particles can scatter light, and changes in background composition may confuse a model. Spectroscopy often offers rich data, but rich data are not automatically reliable composition data.
🧫 Use sampling when inline measurement is not enough
Laboratory sampling remains essential for validation, troubleshooting, and analytes that cannot be measured robustly online. The sample point must be representative, safely accessible, and designed to avoid phase separation, flashing, air ingress, or contamination.
Sampling introduces delay. A sample drawn from a long line may describe the process as it was minutes earlier, and cooling can change equilibrium chemistry. Record sampling time, point, temperature, and handling conditions so laboratory results can be compared fairly with online measurements.
🧭 Place sensors after mixing, not after injection
Adding acid, caustic, salt, or cleaning chemical creates local concentration gradients. A sensor immediately downstream of an injection quill may see a chemical plume rather than the bulk stream, causing unstable control or apparent oscillation.
Provide adequate mixing time and, where appropriate, static mixing. The exact distance depends on pipe diameter, flow regime, viscosity, injection design, and mixer performance; a fixed rule based only on pipe lengths is rarely sufficient.
💨 Watch for bubbles and multiphase flow
Gas bubbles interfere with all three measurements. They may interrupt electrical paths in conductivity cells, create unstable pH contact, alter density readings, and scatter light in refractometers or optical analyzers.
Mounting orientation matters. A sensor installed at the top of a horizontal line may trap gas, while a low point may collect solids. Process engineers should review the actual line geometry, flow direction, pressure profile, and likely phase behavior rather than treating the analyzer as an isolated device.
🧱 Consider pressure, flow, and materials compatibility
High velocity can erode probes; low flow can produce slow response and deposits. Pressure can keep volatile components dissolved, while a pressure drop across a sample system can cause flashing and make an apparently simple measurement unrepresentative.
Wetted materials must tolerate the chemical, temperature, pressure, and cleaning regime. Compatibility includes seals, reference junction materials, optical-window materials, and mounting hardware—not just the main sensor body.
🧾 Establish calibration, verification, and adjustment
These terms should not be used interchangeably. Calibration compares instrument response with known standards and establishes or checks the measurement relationship. Verification confirms that performance remains acceptable. Adjustment changes the instrument configuration to bring its output into agreement.
A conductivity standard may verify a cell’s response; pH buffers check offset and slope. For concentration analyzers, independent grab-sample assays are often the most meaningful verification because they test the full process correlation rather than only the electronics.
📊 Evaluate uncertainty instead of chasing false precision
A display showing several decimal places can imply more confidence than the process supports. Total uncertainty can include sensor accuracy, calibration standards, temperature measurement, sampling variation, fouling, process fluctuations, and the conversion model from signal to concentration.
Match displayed resolution and alarm limits to realistic uncertainty. If a concentration correlation is affected by normal changes in background salts, an extremely narrow alarm band may create nuisance alarms instead of better control.
🚨 Set alarms that lead to useful action
Every alarm should answer three questions: what condition is being detected, what could cause it, and what should the operator do? A high-conductivity alarm on a rinse line may indicate residual cleaner, product carryover, or an instrument fault; the response procedure should distinguish among them.
Consider rate-of-change and signal-quality alarms in addition to high and low limits. Sudden jumps, frozen values, failed temperature elements, or implausible slopes can be more revealing than the process value alone.
🧠 Avoid common interpretation mistakes
- Assuming a neutral pH means a stream is harmless. Corrosivity, toxicity, temperature, and dissolved species still matter.
- Reporting conductivity as “total dissolved solids” without a validated conversion. Different ions conduct differently.
- Using a concentration correlation outside its validated temperature or composition range.
- Comparing a hot inline value to a cooled laboratory result without checking the temperature basis.
- Treating a stable reading as proof of accuracy when a coated or drifting sensor can also be stable.
🔧 Diagnose a suspicious reading systematically
Start by asking whether the process has changed: flow, temperature, feed ratio, batch stage, chemical addition, or upstream equipment status. Then examine sensor diagnostics, temperature agreement, installation conditions, and recent maintenance history.
If needed, clean and verify the instrument with appropriate standards, then compare it with a properly collected sample and a suitable reference method. Avoid immediately “correcting” the transmitter to match one grab sample; first determine whether the sample, online measurement, or comparison basis is at fault.
🦺 Build safety into measurement work
Analyzer maintenance can expose personnel to hot liquids, pressure, acids, caustics, solvents, and contaminated wastewater. Isolation, depressurization, flushing, personal protective equipment, and documented procedures are part of measurement quality because unsafe access encourages deferred maintenance.
For hazardous or toxic service, a closed-loop sample system, retractable probe with isolation, or remote analyzer may be appropriate. The best technical measurement is of limited value if it cannot be calibrated and serviced safely.
🔗 Combine measurements for stronger process insight
A single measurement is often ambiguous. Combining pH, conductivity, temperature, flow, density, and laboratory assays can reveal a clearer process story. For example, pH may confirm neutralization direction while conductivity indicates salt loading and flow confirms whether dilution is occurring.
Use these signals as complementary evidence, not as substitutes without validation. A multivariable approach is particularly useful when contamination, variable feedstock, or batch transitions make any one signal incomplete.
🏭 Example: detecting a clean-in-place rinse endpoint
Consider a hypothetical beverage line after an alkaline cleaning cycle. Conductivity may fall sharply as water displaces the cleaning solution, making it an effective endpoint indicator. A pH measurement can provide supporting evidence that the return stream is no longer strongly alkaline.
Neither measurement alone proves microbiological cleanliness or absence of every residue. The facility still needs a validated cleaning procedure and acceptance criteria. Here, online instruments reduce unnecessary water use and provide process visibility; they do not replace sanitation validation.
📚 Document the measurement basis
Good records state more than the displayed value. They identify the instrument tag, sensor type, location, units, temperature basis, calibration standards, concentration correlation version, maintenance status, and applicable operating range.
This documentation makes troubleshooting faster when results disagree. It also prevents a common failure: transferring a correlation or setpoint from one line to another even though the sensor geometry, temperature profile, or background chemistry has changed.
✅ The core principle: measure the stream, not just the signal
Reliable industrial analysis begins with chemistry and process context. pH is powerful for acid-base control but reflects hydrogen-ion activity. Conductivity is fast and robust for ionic content but is not automatically concentration. Concentration methods work best when the component, matrix, temperature, and calibration model are clearly defined.
The practical sequence is straightforward: define the decision, select a measurement with a defensible relationship to that decision, install it in a representative location, maintain it, and verify it against independent evidence. That sequence is more valuable than any individual analyzer feature.
A trustworthy process measurement is not merely a number on a screen; it is a maintained link between the real stream, the measurement principle, and the decision being made. 🧪📈⚙️