As pointed out previously, the use of flow reactors allows for the direct measurement of reaction rates. At steady state (unlike the batch reactor), the time scales of the analytical technique used and the reaction are decoupled. Additionally, since numerous samples can be acquired at the same conditions, the accuracy of the data dramatically increases. Consider the following problem. In the petrochemical industry, many reactions are oxidations and hydrogenations that are very exothermic.
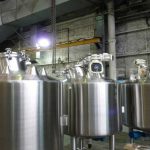
Thus, to control the temperature in an industrial reactor the configuration is typically a bundle of tubes (between 1 and 2 inches in diameter and thousands in number) that are bathed in a heat exchange fluid. The high heat exchange surface area per reactor volume allows the large heat release to be effectively removed.
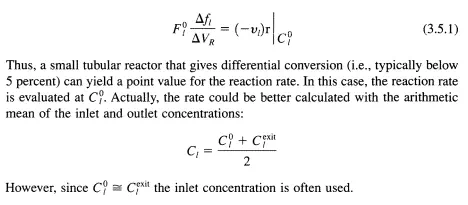
Suppose that a new catalyst is to be prepared for ultimate use in a reactor of this type to conduct a gas-phase reaction. How are appropriate reaction rate data obtained for this situation? Consider first the tubular reactor. From the material balance (Table 3.5.1), it is clear that in order to solve the mass balance the functional form of the rate expression must be provided because the reactor outlet is the integral result of reaction over the volume of the reactor. However, if only initial reaction rate data were required, then a tubular reactor could be used by noticing that if the differentials are replaced by deltas, then:
For the generic reaction A =}B the following three reaction rate expressions were proposed to correlate the initial rate data obtained. Describe how a differential tubular reactor could be used to discriminate among these models:
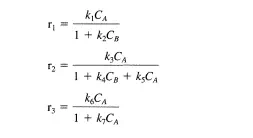
Clearly rj can be distinguished from rz and r3 by varying CA such that a plot of r versus CA can be obtained. Now suppose that rj does not describe the data. In a second set of experiments, B can be added to the feed in varying amounts. If r3 is the correct rate expression, then the measured rates will not change as CB is varied. If there is a dependence of the observed rate on the concentration of feed B, then r3 cannot describe the data.