A batch reactor by its nature is a transient closed system. While a laboratory batch reactor can be a simple well-stirred flask in a constant temperature bath or a commercial laboratory-scale batch reactor, the direct measurement of reaction rates is not possible from these reactors. The observables are the concentrations of species from which the rate can be inferred. For example, in a typical batch experiment, the concentrations of reactants and products are measured as a function of time.
From these data, initial reaction rates (rates at the zero conversion limit) can be obtained by calculating the initial slope (Figure 3.5.1b). Also, the complete data set can be numerically fit to a curve and the tangent to the curve calculated for any time (Figure 3.5.la). The set of tangents can then be plotted versus the concentration at which the tangent was obtained (Figure 3.5.1c). If, for example, the reaction rate function is first-order, then a plot of the tangents (dC/dt) versus concentration should be linear with a slope equal to the reaction rate constant and an intercept of zero. It is clear that the accuracy of the
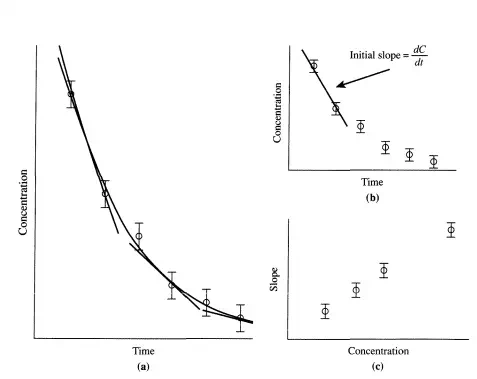
data (size of the error bars) is crucial to this method of determining good reaction rates. The accuracy will normally be fixed by the analytical technique used. Additionally, the greater the number of data points, the better the calculation of the rate. A typical way to measure concentrations is to sample the batch reactor and use chromatography for separation and determination of the amount of each component. In the best cases, this type of procedure has a time-scale of minutes. If the reaction is sufficiently slow, then this methodology can be used. Note, however, that only one datum point is obtained at each extent of reaction (i.e., at each time). If the reaction is fast relative to the time scale for sampling, then often it is not possible to follow the course of the reaction in a batch reactor.
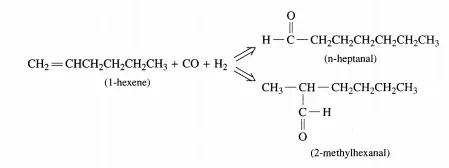
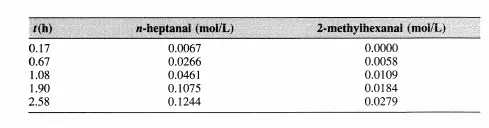
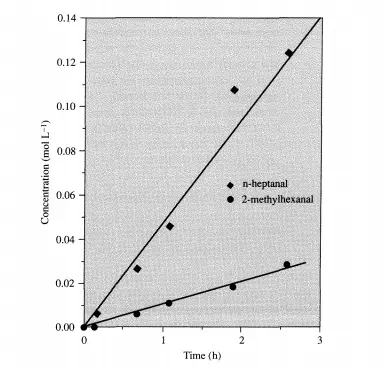
This homogeneous hydroformylation reaction was conducted in a batch reactor, and because of the nature of the catalyst, isomerization reactions of I-hexene to 2- and 3-hexenes and hydrogenation reactions of hexenes to hexanes and aldehydes to alcohols were minimized. The following data were obtained at 323 K with an initial concentration of I-hexene at 1 mol/L in toluene and Pea = PH2 = PN2 (inert) = 0.33 atm. Calculate the initial rates of formation of the linear, rN, and branched, rs, aldehydes from these data.
Ideally, much more data are required in order to obtain a higher degree of confidence in the reaction rate expressions. However, it is clear from Examples 3.5.1 and 3.5.2 how much experimental work is required to do so. Also, note that these rates are initial rates and cannot be used for integral conversions.