The scheme of the setup for continuous handling of solid-forming reactions in the CSTR cascade is shown in Fig. S2 (see the ESI†). The reagents for the reactions were dissolved into two separate solutions, which were pumped into the CSTR cascade by HPLC pumps. There was an in-line pressure sensor (Ashcroft G2) connected at the inlet of the reactor to measure the pressure profile in the reactor system. The CSTR cascade was placed on the magnetic stirrer to spin the magnetic stir bars in the CSTR chambers. Operating the CSTR cascade in the vertical mode helped to minimize clogging at the outlet of the reactor.
Characterization of solid particles
An optical microscope (ZEISS Axiovert 200) was used to characterize the solid particles formed in the CSTR cascade. The particle size distributions were measured by means of a Malvern particle sizer (Malvern Mastersizer 2000). The same solvent was used to ensure that the particle size and morphology did not change when injecting the samples into the particle sizer.
Results and discussion
Miniature CSTR cascade design
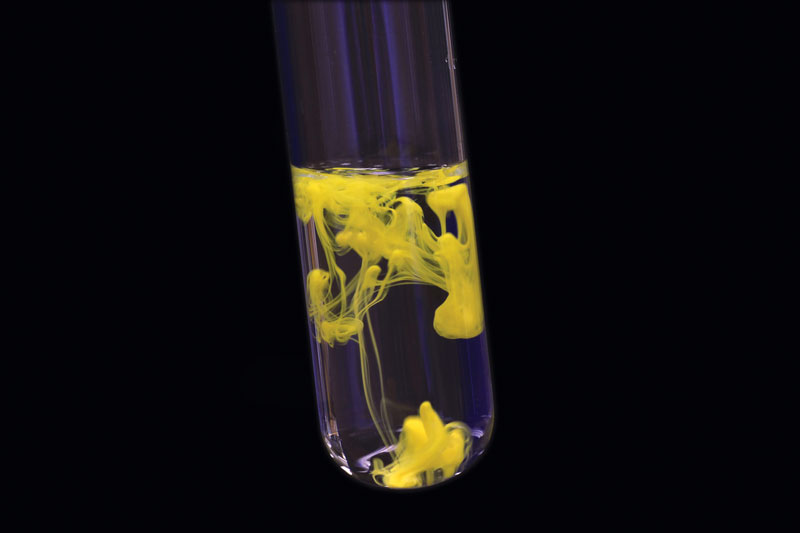
In the constructed miniature CSTR cascade system, each of the polytetrafluoroethylene (PTFE) reactor chambers has an inner diameter of 18 mm and holds a cross-shaped magnetic stirrer bar (Φ 9.5 mm × H 4.7 mm). For simplicity, a single magnetic stirrer plate provides the driving force for all stir bars. A more complex rotation system is also available to enable individual speed control for each stir bar (Fig. S4†). Based on the magnetic coupling force available from the stirrer plate, spinning the stir bar at a maximum speed of 600 rotations per minute (RPM) increases the local flow speed to keep particles suspended against gravity, particle–wall interaction, and particle–particle interaction. At the same time, agitation enhances mixing and heat transfer in each CSTR chamber. PTFE has good chemical compatibility suitable for common organic reactions, and the non-stick nature of PTFE contributes to reducing the particle–wall interactions to avoid build-up of particles on the reactor walls. The chamber is covered by heat-resistant borosilicate glass (Pyrex), allowing particle flow in the chamber to be viewed. In order to minimize the chances of clogging the 3.2 mm-diameter flow channel between two adjacent CSTR chambers, the units are placed in close contact to avoid interconnections becoming the threshold of the cascade. The system is simple to assemble for reactor cleaning and rearrangement.
The residence time distribution (RTD) profile of the single-stage CSTR exhibits an exponential decay,38 which is usually undesired when side reactions exist in the system. A narrow RTD profile is favored for increasing yield and selectivity. Connecting CSTRs in series (Fig. 1b) narrows the RTD and approaches plug flow reactor (PFR) behavior for a large number of CSTRs.38 Thus, the RTD profile can be tuned from CSTR to PFR characteristics by choosing the number of CSTRs.
Assessment of mixing properties
Dead volume and bypass are two key factors that introduce non-ideality in CSTRs making it difficult to predict the performance for a given reaction. RTD measurements for different numbers of CSTRs in series yielded the expected trend of RTD profiles with increasing the reactor number (Fig. 3). The RTD profiles of a single CSTR and 3, 5, and 7 CSTRs in series were determined for constant mean residence time (reactor volume divided by the flow rate).
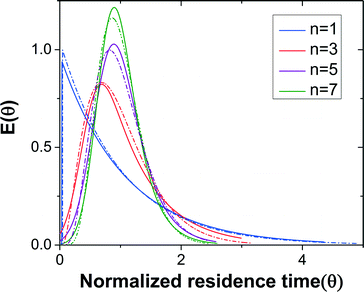
Fig. 3 RTD profiles of n = 1, 3, 5, and 7 CSTRs in series. Solid lines are regressed experimental RTD profiles based on the EMG model and dashed lines represent the profiles based on the ideal CSTRs in series model.
Since the tracer pulse injected was not a perfect pulse, the outlet concentration profile was a convolution of the inlet concentration profile and RTD. The discrete fourier transform method would be preferred for deconvolution of the signals due to its simplicity, but noise in the data and the large number of data points introduced numerical errors. Therefore, we extracted the RTD from the inlet and outlet concentration profiles by model regression with the exponentially modified Gaussian (EMG) distribution model (eqn (1)). This model combines exponential decay and Gaussian distribution, which is generally suitable for RTD
profiles that contain only one peak.
The outlet concentration profiles given by the convolution of the inlet concentration and regressed EMG model show excellent agreement with the experimentally measured outlet concentration profiles (Fig. S3†) showing that the EMG model is efficient in extracting the RTD profiles of the CSTR cascade. The tail of the outlet concentration profile becomes shorter when the number of CSTRs increases as expected since the cascade will approach plug flow reactor (PFR) behavior as the number of units becomes large.38
The mixing performance of the CSTRs was assessed by comparing the regressed EMG model to the RTD of the ideal CSTRs in series model (eqn (2)).38(2)
For the same number of CSTRs in series, the ideal and measured RTD profiles show high consistency (Fig. 3), which suggests that the agitation provided by the magnetic stir bar in each chamber is sufficient to achieve rapid mixing and reproduce the CSTR characteristics. In addition, the dead volume in the reactor is nearly negligible. The RTD profile becomes sharper with increasing number of CSTRs as expected. The nearly ideal CSTR cascade performance is essential for predicting the performance of an existing reaction system and rationally designing new processes.
Predicting reaction conversions in the CSTR cascade
Considering the nearly ideal CSTR mixing characteristics in each chamber of the miniature CSTR cascade, we decided to characterize the system by predicting reaction conversions based on reaction kinetics and RTD information. The Diels–Alder reaction between maleic acid anhydride and isoprene (Scheme 1) served as a model based on reported kinetic data.40–42
The reaction temperature was set to 50 °C to have a moderate rate of reaction and significant differences in conversions for different residence times. We ran 1-, 3-, 5-, and 7-unit CSTR cascades at a constant flow rate of 400 μl min−1. Reaction conversions were computed based on reputed kinetic data (k = A × exp(−Ea/RT), A = (4.02 ± 2.5) × 106 L mol−1 s−1, Ea = 58.5 ± 2.0 kJ mol−1)41 along with an ideal CSTR cascade model. The experimental values fall at the lower side of the envelope of predicted conversions based on the reported uncertainty in rate constants (Fig. 4). The close agreement between predicted and measured conversions is consistent with the RTD results in Fig. 3. We attribute the lower than predicted conversions to the reaction temperature measured at the reactor outer wall, which would be slightly higher than the temperature of reactants inside the reactor given the external heating. Constructing the CSTR in stainless steel would reduce temperature gradients. We chose PTFE for its chemical compatibility and higher barrier for nucleation of solids on the walls.
Fig. 4 Comparison of measured and predicted reaction conversions for different numbers of CSTRs. Cross-hatched area: predicted conversions. Predicted conversions are based on an ideal CSTR cascade model.
