A pump’s performance is shown in its characteristics performancecurve where its capacity i.e. flow rate is plotted against its developed head. The pump performance curve also shows its efficiency (BEP), required input power (in BHP), NPSHr, speed (in RPM), and other information such as pump size and type, impeller size, etc. This curve is plotted for a constant speed (rpm) and a given impeller diameter (or series of diameters). It is generated by tests performed by the pump manufacturer. Pump curves are based on a specific gravity of 1.0. Other specific gravities must be considered by the user.
Normal Operation Range
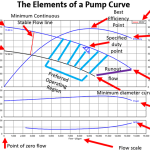
A typical performance curve (Figure 10) is a plot of Total Head vs. Flow rate for a specific impeller diameter. The plot starts at zero flow. The head at this point corresponds to the shut-off head point of the pump. The curve then decreases to a point where the flow is maximum and the head minimum. This point is sometimes called the run-out point. The pump curve is relatively flat and the head decreases gradually as the flow increases. This pattern is common for radial flow pumps. Beyond the run-out point, the pump cannot operate. The pump’s range of operation is from the shut-off head point to the run-out point. Trying to run a pump off the right end of the curve will result in pump cavitation and eventually destroy the pump.
By plotting the system head curve and pump curve together, you can determine:
1.Where the pump will operate on its curve?
2.What changes will occur if the system head curve or the pump performance curve changes?